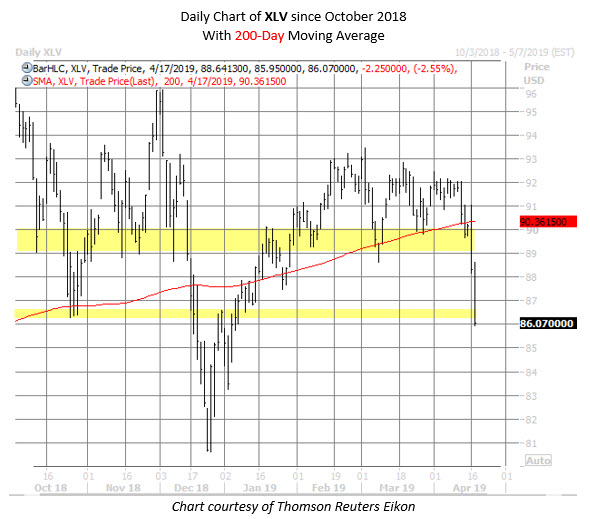
It's been a brutal week for healthcare stocks, as traders head to the sidelines on concerns about potential policy changes out of Washington, D.C., including a "Medicare for All" bill from Sen. Bernie Sanders of Vermont. The sector-wide sell-off is nowhere more evident than in the Health Care Select Sector SPDR ETF (NYSE:XLV), which is on pace for its worst week of 2019. What's more, XLV options traders are betting on more downside for the exchange-traded fund (ETF) in the short term.
XLV was last seen 2.6% lower at $86.07, set for its lowest close since early January. In fact, the fund is now in the red year-to-date, dipping below its 2018 close of $86.51 -- an area that supported the shares during the October pullback. Further, XLV is trading well south of former support in the $89-$90 neighborhood, which has acted as a floor in recent months, as well as its 200-day moving average. Already this week, the ETF has shed 4.2%, set for its worst week since December.

Already today, roughly 93,000 XLV put options have changed hands -- far surpassing the previous annual high of about 69,000 puts traded in one day on Oct. 11. What's more, today's put volume is running at 12 times the average intraday pace, and more than six times the number of XLV calls exchanged thus far.
The May 85 put is most active, with nearly 20,000 contracts across the tape. About half of that volume traded in one fell swoop this morning, with a block of 10,300 contracts likely bought to open for 97 cents apiece. By purchasing the puts to open, the buyers' profit will increase the lower XLV sinks beneath $84.03 (strike minus premium paid) before the options expire on Friday, May 17.
Along with the May 85 put, traders are opening new positions at the May 77 and 82 puts, as well as the June 83 put. In fact, the top 10 most active XLV options today are puts that expire within the next couple of months.
XLV also saw notable put activity yesterday, particularly at the June 85 put, where more than 11,500 contracts were added overnight. This strike is now home to peak put open interest among all series of options, with more than 13,000 contracts outstanding. In the short term, this abundance of put open interest could translate into a layer of options-related support for XLV.
However, this week's appetite for bearish bets merely echoes the growing trend seen on the International Securities Exchange (ISE), Chicago Board Options Exchange (CBOE), and NASDAQ OMX PHLX (PHLX). Specifically, XLV sports a 10-day put/call volume ratio of 3.71, indicating traders have bought to open nearly four puts for every call on the ETF in the past two weeks. This ratio registers in the 85th percentile of its annual range, underscoring a bigger-than-usual bearish bias among option buyers of late.
