
Bed Bath & Beyond Inc. (NASDAQ:BBBY) is among the stocks that delivered solid top- and bottom-line performances in the near past. Notably, the company reported the second straight quarter of earnings and sales beat in fourth-quarter fiscal 2017. Results were driven by solid sales growth, owing to the progress on its transformation efforts and other customer-centric initiatives. (Read More: Bed Bath & Beyond Down Despite Earnings Beat in Q4).
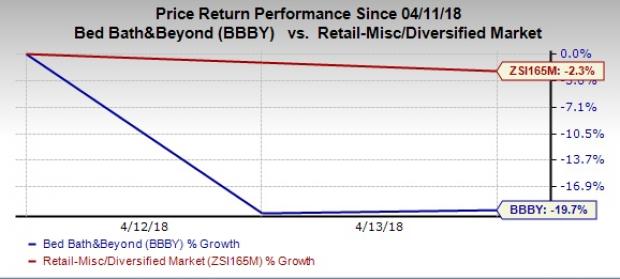
However, this was not enough to woo investors as is clear from the significant drop in the company’s stock price since reporting the fourth-quarter fiscal 2017 results on Apr 11, 2018. The Bed Bath & Beyond stock fell as much as 19.7% since Apr 11, wider than the industry’s decline of 2.3%. The stock was mainly punished due to a weak fiscal 2018 outlook as the company expects the soft margin and comps trend to continue in the future.
The company’s comps declined in fourth-quarter fiscal 2017 due to the lower number of store transactions, somewhat mitigated by higher average transaction amounts. While comps from customer-facing digital networks improved, comps at stores fell at a mid-single-digit rate. Further, the company has a seven-quarter long trend of reporting strained margins due to higher shipping and coupon expenses, which continued in the fiscal fourth quarter.
Consequently, the company provided a bleak outlook for fiscal 2018, which is likely to bear a 5 cents negative impact due to the absence of the 53rd week compared with the previous year. It expects a clear shift of sales and expenses from the fiscal fourth quarter to the third quarter due to the calendar shift. The company anticipates an earnings shift from the third quarter to the fourth quarter as well.
For fiscal 2018, the company expects consolidated net sales to remain relatively flat to marginally up year over year. Driven by persistent growth in the customer-facing digital channel, it envisions comps to increase in the low-single-digit percentage range.
Furthermore, Bed Bath & Beyond projects gross margin deleverage in fiscal 2018, mainly owing to continued investment in the customer value proposition and the constant shift to the digital channels. SG&A is estimated to increase on account of investments toward transformation. However, the company expects to witness operating margin to decline lower than that in fiscal 2017. Depreciation expenses are anticipated to be $315-$325 million while net interest expenses are projected to be $75 million. It also expects the tax rate to be 26-27% for the fiscal.
Considering all these factors, the company envisions fiscal 2018 earnings per share to be in the low-to-mid-$2 range compared with adjusted earnings per share of $3.12 in fiscal 2017.
Driven by the soft earnings view, the Zacks Consensus Estimate witnessed a downtrend in the last seven days. Estimates for the first quarter and fiscal 2018 declined 13 cents and 40 cents, respectively, to 33 cents per share and $2.36 per share. Moreover, estimates for fiscal 2019 dropped 57 cents to $2.02 per share.
Bed Bath & Beyond Inc. Price, Consensus and EPS Surprise
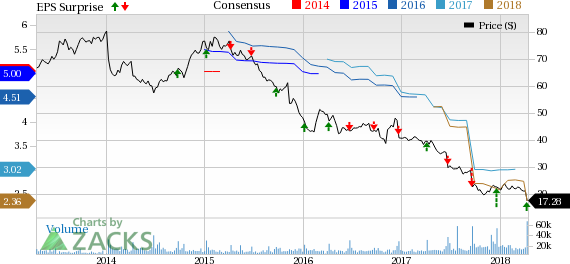
Bed Bath & Beyond Inc. Price, Consensus and EPS Surprise | Bed Bath & Beyond Inc. Quote
Rightly, the stock currently carries a Zacks Rank #5 (Strong Sell). Furthermore, a Momentum Score of C highlight that there are more troubles ahead for the stock.
Not Done Yet? Check These 3 Trending Retail Stocks
Some better-ranked stocks in the retail sector include KAR Auction Services, Inc (NYSE:KAR) , The Gap Inc. (NYSE:GPS) and Nordstrom Inc. (NYSE:JWN) . KAR Auction Services sports a Zacks Rank #1 (Strong Buy), while Gap and Nordstrom carry Zacks Rank #2 (Buy). You can see the complete list of today’s Zacks #1 Rank stocks here.
KAR Auction, with long-term earnings growth rate of 11%, has gained 11.1% in the last six months.
Gap has delivered an average positive earnings surprise of 11.1% in the trailing four quarters. It has long-term earnings growth rate of 8%.
Nordstrom has long-term EPS growth rate of 6%. Further, the stock has returned 14.3% in the last six months.
Investor Alert: Breakthroughs Pending
A medical advance is now at the flashpoint between theory and realization. Billions of dollars in research have poured into it. Companies are already generating substantial revenue, and even more wondrous products are in the pipeline.
Cures for a variety of deadly diseases are in sight, and so are big potential profits for early investors. Zacks names 5 stocks to buy now.
Click here to see them >>
The Gap, Inc. (GPS): Free Stock Analysis Report
Nordstrom, Inc. (JWN): Free Stock Analysis Report
Bed Bath & Beyond Inc. (BBBY): Free Stock Analysis Report
KAR Auction Services, Inc (KAR): Free Stock Analysis Report
Original post
Zacks Investment Research