Friday September 7: Five things the markets are talking about
Trade talks, tariffs threats, EM contagion fears and central bank decisions are dominating asset price moves this month.
Add geopolitical risks and U.S impeachment possibilities, market volatility is expected to remain elevated for the foreseeable future.
Global equities traded mixed overnight as investors await the latest word on trade wars and today’s payroll reports from the U.S and Canada.
The ‘big’ dollar has eased a tad ahead of U.S jobs data (08:30 am EDT), while Treasuries are steady. EM equities snapped a week of declines while their currencies rallied.
There are no major economic calendar events scheduled for this weekend. On Sunday, there is the Swedish general election and the market will be interested in the growth of the right wing.
Note: The ‘hard’ right party is expected to get around +20% of the vote. While that would make it one of the largest single parties, others are in coalitions and centre right and centre left expected to achieve +40% each.
On tap: Investors turn to the U.S payrolls report for August which is expected to show a robust rise of +191K and an unemployment rate of +3.8%.
1. Stocks mixed
U.S. equity futures are little changed ahead of NFP, following a mostly negative session in Asia, where stocks closed out the worst week in six-months.
In Japan, the Nikkei continued its slide into a six consecutive session dropping to a three-week low as investors sold chip equipment makers and on concerns that President Trump could be contemplating taking on Japan over trade. The benchmark share average dropped -0.8%. For the week, the Nikkei plummeted -2.4%, its biggest weekly fall in six-months. The broader Topix declined -0.5%.
Down-under, Aussie stocks fell again overnight, for a seventh consecutive session; on the back of the possibility the Sino-U.S trade war could escalate any time. The S&P/ASX 200 index fell -0.3% at the close. For the week, the index shed -2.8%. In S. Korea, tumbled -0.26% overnight and is down -1.8% on week.
In Hong Kong, stocks ended flat overnight as investors fear new U.S tariffs. The Hang Seng index ended down -0.01%, while the China Enterprises Index closed -0.18% lower.
In China, shares edge higher in cautious trade as tariff comment deadline expired. At the close, the Shanghai Composite index was up +0.4%. The index was down -0.8% for the week, while the blue-chip CSI 300 Index ended +0.45% higher, but was down -1.7% for the week.
In Europe, regional bourses trade mixed in a quiet session ahead of N. American jobs data.
U.S stocks are set to open in the ‘red’ (-0.1%).
Indices:{{40823|STOXX 600} }-0.1% at 373.2, FTSE -0.2% 7304, DAX -0.1% at 11947, CAC 40 +0.1% at 5249, IBEX 35 -0.2% at 9194, FTSE MIB +0.0% at 20530, SMI +0.2% at 8836, S&P 500 Futures -0.1%

2. Oil steady as U.S crude inventories fall, but trade tensions weigh, gold higher
Oil prices are little changed despite a fall in U.S crude inventories to the lowest levels in three-years, although Sino-U.S trade tensions and economic weakness from emerging markets remain a concern.
Brent crude futures are up +8c at +$76.58 a barrel, while U.S West Texas Intermediate (WTI) crude is at +$67.93 per barrel, up +16c from Thursday’s close.
According to the EIA’s report yesterday, U.S commercial crude oil inventories fell by -4.3M (NYSE:MMM) barrels to +401.49M barrels in the week to Aug. 31, the lowest since February 2015.
Despite that, crude prices have been limited by a rise in refined product stocks and a relatively weak U.S driving season. Also not helping is the ongoing EM weakness. Investors can expect potential new U.S import tariffs on Chinese goods to continue to weigh on oil market sentiment.
Ahead of the U.S open, gold has extended its gains overnight as the U.S dollar fell against the yen on news that President Trump would next take up trade issues with Japan, while investors feared another round of Sino-U.S tariffs at any moment.
Spot gold is up +0.1% at +$1,200.88, after printing a one week high Thursday at +$1,206.98. U.S gold futures have rallied +0.2% to +$1,206.40 an ounce.

3. Italian yields fall
Italy’s borrowing costs have fallen to a one-month low this morning and the best week for prices in three-months, thanks to easing concern over fiscal spending worries from the new anti-establishment government.
Short-dated Italian BTP yields have fallen more than -50 bps this week after reassuring comments from Rome that the sitting government would respect E.U rules on fiscal discipline.
Note: Italy’s 10-year BTP yield has fallen more than -7 bps to +2.83%, its lowest in four-weeks – it has fallen -40 bps this week.
Elsewhere, the yield on 10-year Treasuries has climbed +1 bps to +2.88%. In Germany, the 10-year Bund yield has advanced +1 bps to +0.36%, while in the U.K, the 10-year Gilt yield has increased +1 bps to +1.416%.
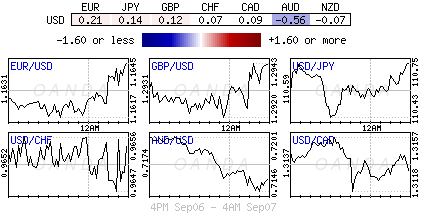
4. Dollar waits for NFP
Today’s U.S August jobs data is expected to show more job creations (+191K), which could bode well for the U.S dollar, especially against EM currencies and riskier developed market currencies like the AUD (a proxy for China).
Note: USD is a tad softer against G7 currency pairs ahead of NFP – trade could quickly move back to the front burner if the U.S decides to implement the +$200B in additional tariffs on China now that the public comment period related to the US proposed tariffs has expired overnight.
With a ‘no’ sign of U.S slowdown, will permit President Trump to proceed with his trade tactics, and keep the Fed on its steady rate-hiking path.
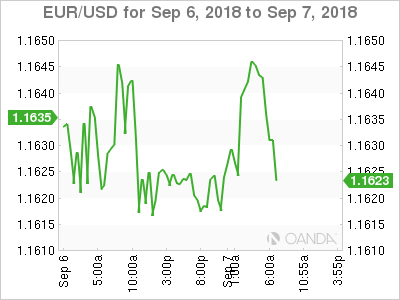
EUR/USD up +0.2% at €1.1644, but AUD/USD is down -0.7% at A$0.7155, having dropped to a 20-month low at A$0.7137. The EUR has got a lift from lower Italian BTP yields (see above).

5. Eurozone economic growth falls further behind U.S
Data this morning showed that the eurozone’s economy slowed slightly in Q2, as imports jumped despite weak household spending.
The E.U statistics agency said Q2 GDP was +0.4% larger than Q1, and +2.1% up on the same period a year earlier. That was the equivalent of an annualized rate of +1.5%, just below the +1.6% rate of expansion recorded in Q1.
Note: The loss of momentum stands in contrast with the U.S (+4.2%), where growth has surged in the same time period due to a package of tax cuts and government spending increases.