There are no “sure things” in the financial markets. There are however, certain “high probability” things. Like for instance, a summer sell off in soybeans (and corn for that matter, but let’s keep it simple and look at beans).
The “typical” pattern for soybeans is that during the winter and early spring months – when there are no actual soybeans planted in the ground in the Midwest and therefore uncertainty is high regarding the current year’s crop – bean prices rise. Then after the expected state of the current year’s crop becomes known in late spring and into summer, bean price fall.
That didn’t happen this year. Like I said, there are no “sure things”.
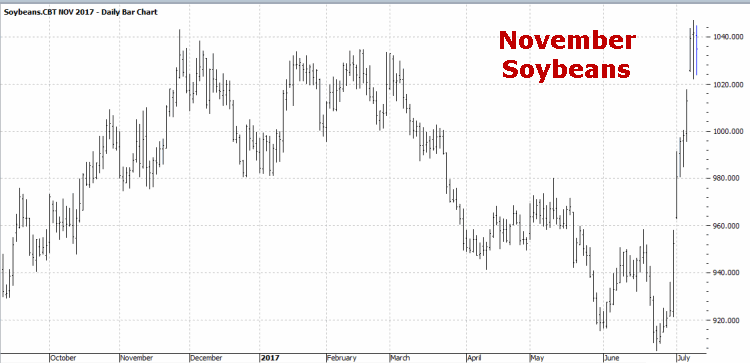
As you can see in Figure 1 November soybean futures went sideways from December into March and then declined steadily into June, before staging a massive rally in the past two weeks to end up where we would typically expect them to be by early July – i.e., at or near a high or the year.

Figure 1 – November Soybeans (Courtesy ProfitSource by HUBB)
Where to from here? Historically the early July into early August period has been extremely rough for soybeans.
Specifically the seasonally unfavorable period extends from:
*The close on July Trading Day #9 (7/14/2017 this year)
*To the close on August Trading Day #6 (8/8/2017)
The History
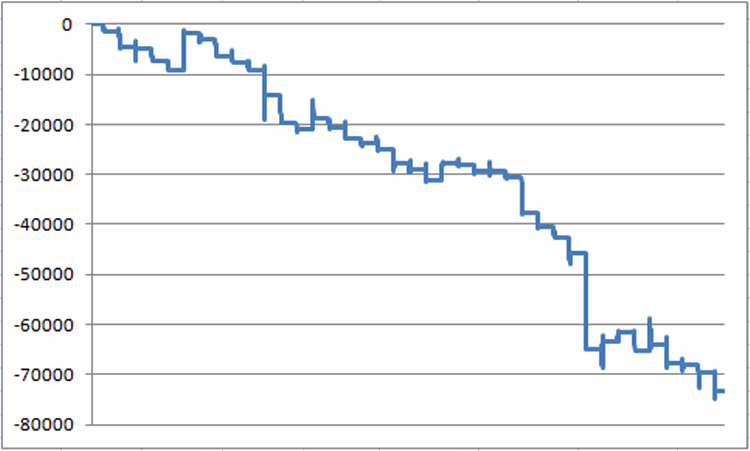
Figure 2 displays the cumulative dollar gain/loss achieved by holding long one soybean futures contract from the close on July TDM #9 through August TDM#6 every year since 1978. As you can see it is not a pretty picture.

Figure 2 – Cumulative $ +/- holding long 1 soybean futures contract during unfavorable summer seasonal period (1978-2016)
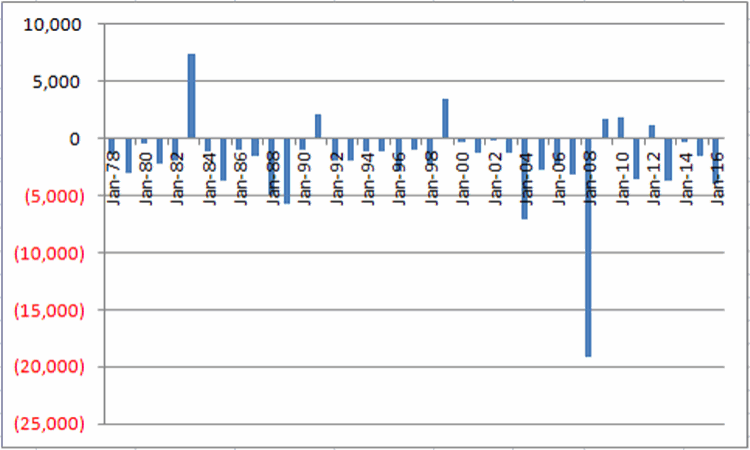
Figure 3 shows the year-by-year gain/loss.

Figure 3 – Yearly $ +/- holding long 1 soybean futures contract during unfavorable summer seasonal period (1978-2016)
For the record:
*6 times (15% of the time) this period has showed a gain for beans
*33 times (85% of the time) this period has showed a loss for beans
As always, note that 15% is NOT 0% which means there is absolutely a chance that beans will advance in the month ahead after the close on 7/14.
But history seems to suggest that that is not the way to bet.
Disclaimer: The data presented herein were obtained from various third-party sources. While I believe the data to be reliable, no representation is made as to, and no responsibility, warranty or liability is accepted for the accuracy or completeness of such information. The information, opinions and ideas expressed herein are for informational and educational purposes only and do not constitute and should not be construed as investment advice, an advertisement or offering of investment advisory services, or an offer to sell or a solicitation to buy any security.
