Analysis for Bitcoin Cash to BTC. Updated BCH scenario, based on growing Bitcoin. Targets to trade Bitcoin Cash. Bitcoin Cash key levels. In this post, I applied the following tools: fundamental analysis, all-round market view, graphic analysis, market balance level, oscillators, volume profile, key levels, trendline analysis, market sentiment analysis.
I’m carefully watching Bitcoin Cash state and the hot battle between BCH administration and BitPico hacking group.
BCH/BTC developers decided to apply rather primitive tools to fight with the naughty BitPico. BitcoinCash Core started blocking IP addresses of the nods, suspected in unnatural activity, threatening the nods of the users that may be guilty of nothing. This idea looks like a “Mafia” game. First block, then find out, which was killed, a Mafiosi or a common person.
The fact itself that such blocking is possible means the network centralization, badly affecting BCH.
Another thing that hints at BCH centralization is the location of nods. According to BitPico, around a half of all blockchain key nods are on the Alibaba (NYSE:BABA) cloud servers.
This information hasn’t yet been proved, the only fact of such news releases creates negative around BCH.
Another bad sign for Bitcoin Cash almost zero developers’ activity on updating and improving the product itself.
As you see in pictures below, there is almost no BCH activity, compared to Bitcoin, for example.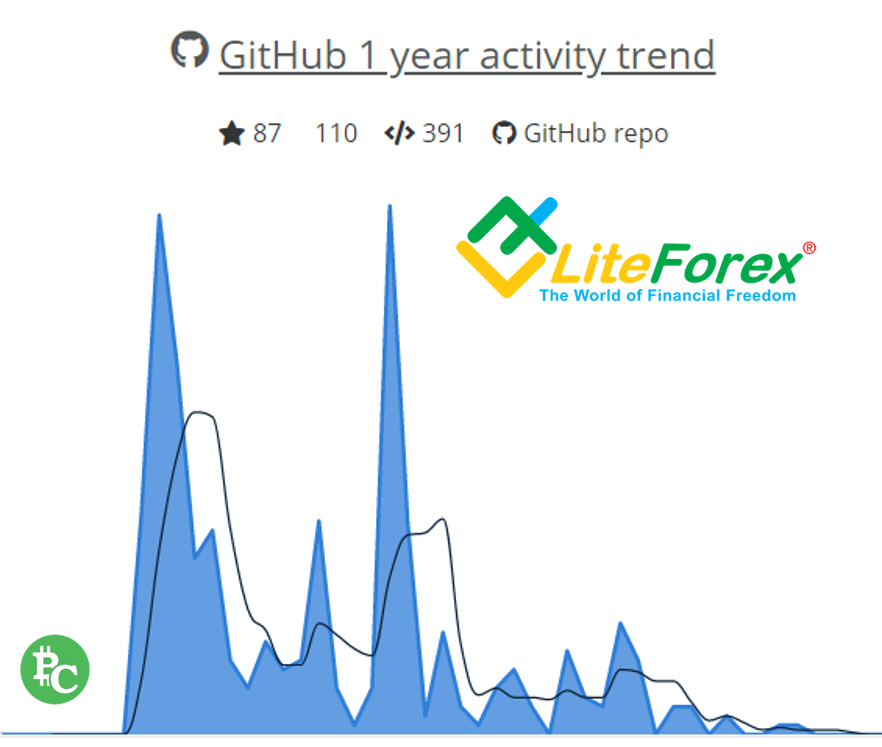
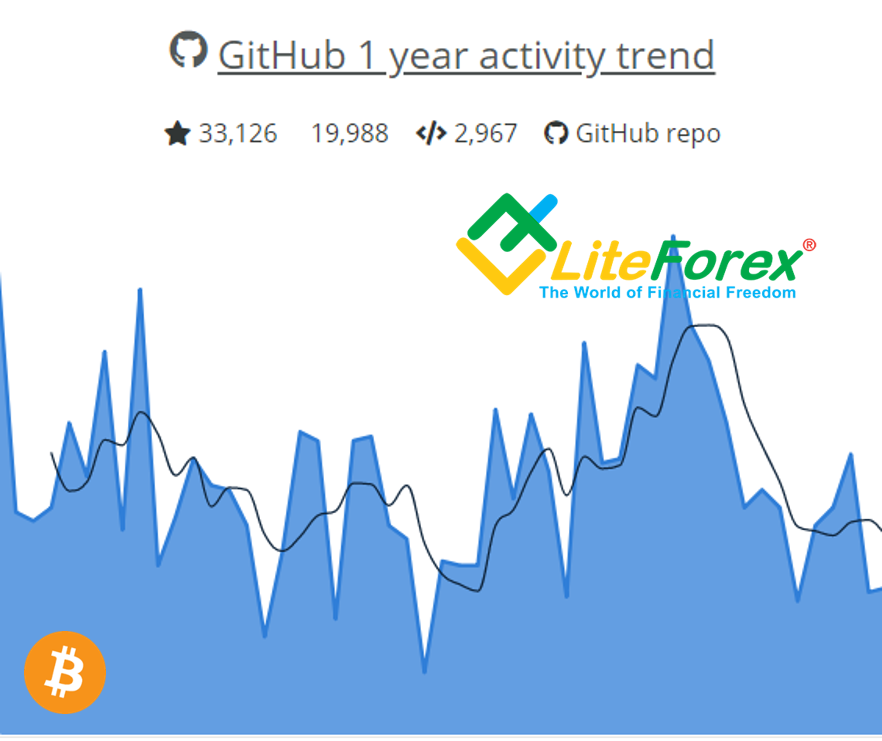
Therefore, fundamental analysis doesn’t inspire any positive. It can be an internal factor, setting back the future BCH price growth.
As for technical analysis, in my earlier forecast dated 28.06, I suggested strong pressure on BCH, considering the danger of that 51% attack (see BCH price chart below).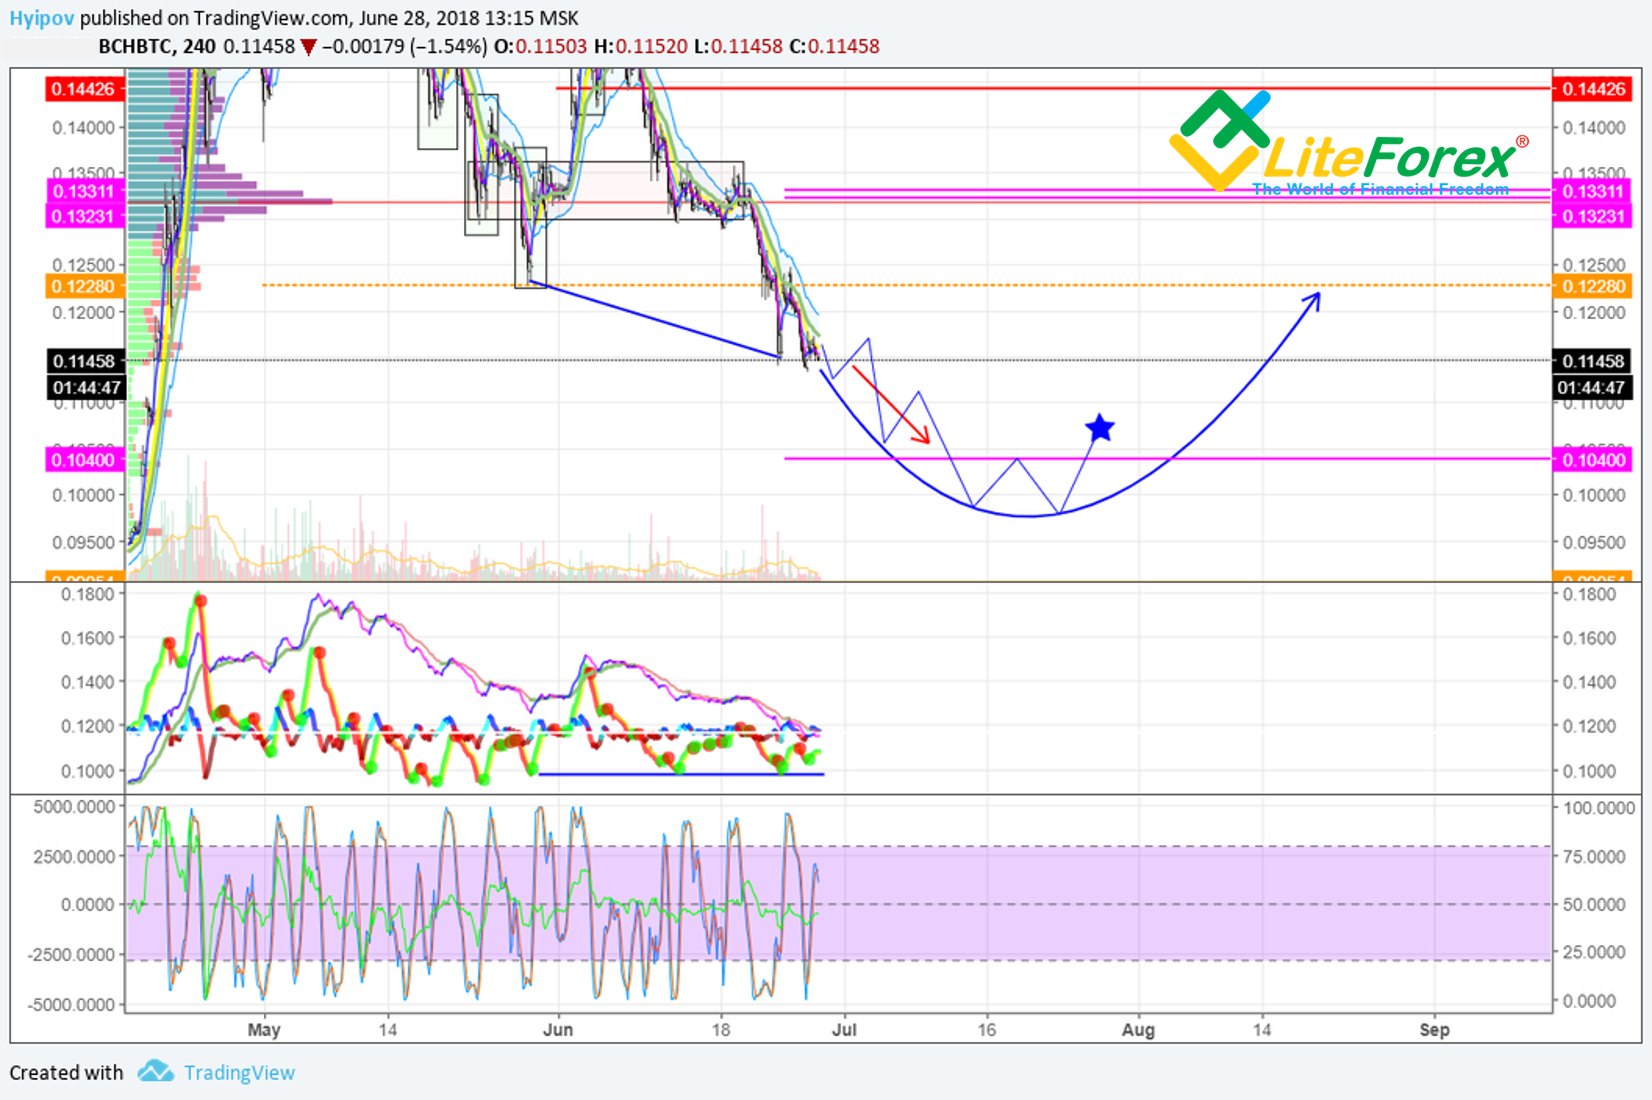
Finally, the real situation for now is like this:
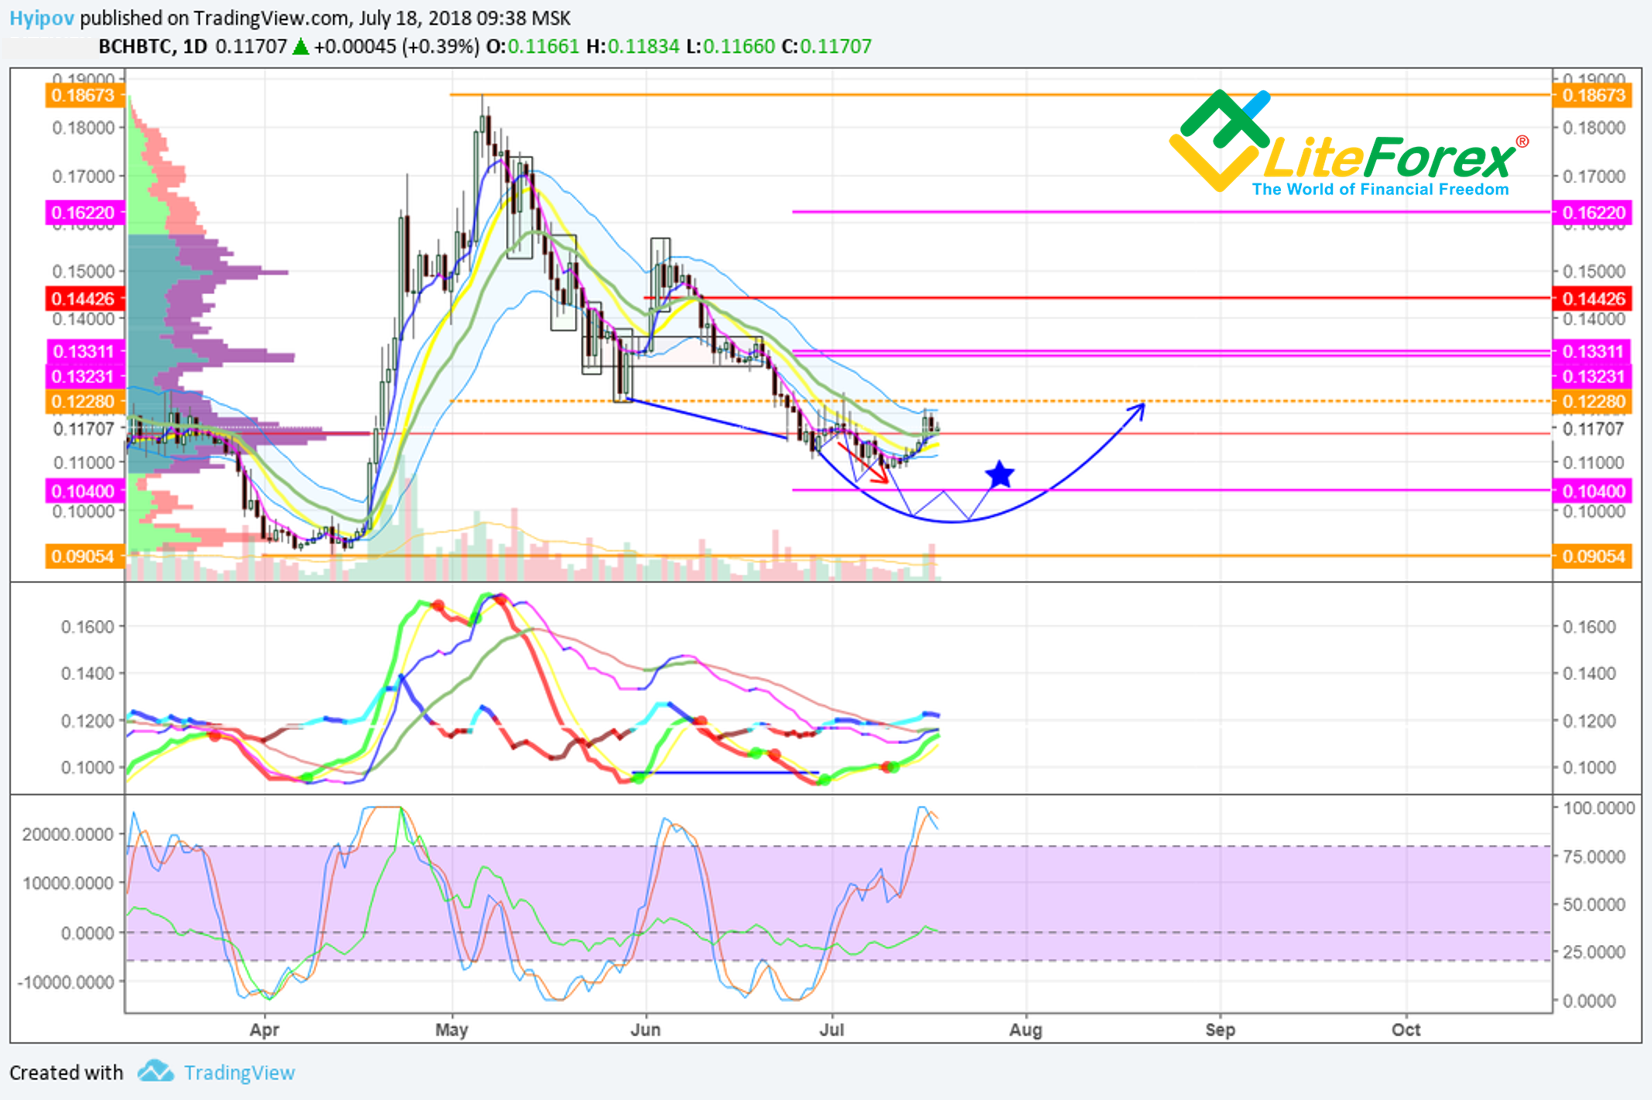
As you see, the global trend was indicated correctly, the drawdown turned out to be not that deep and long.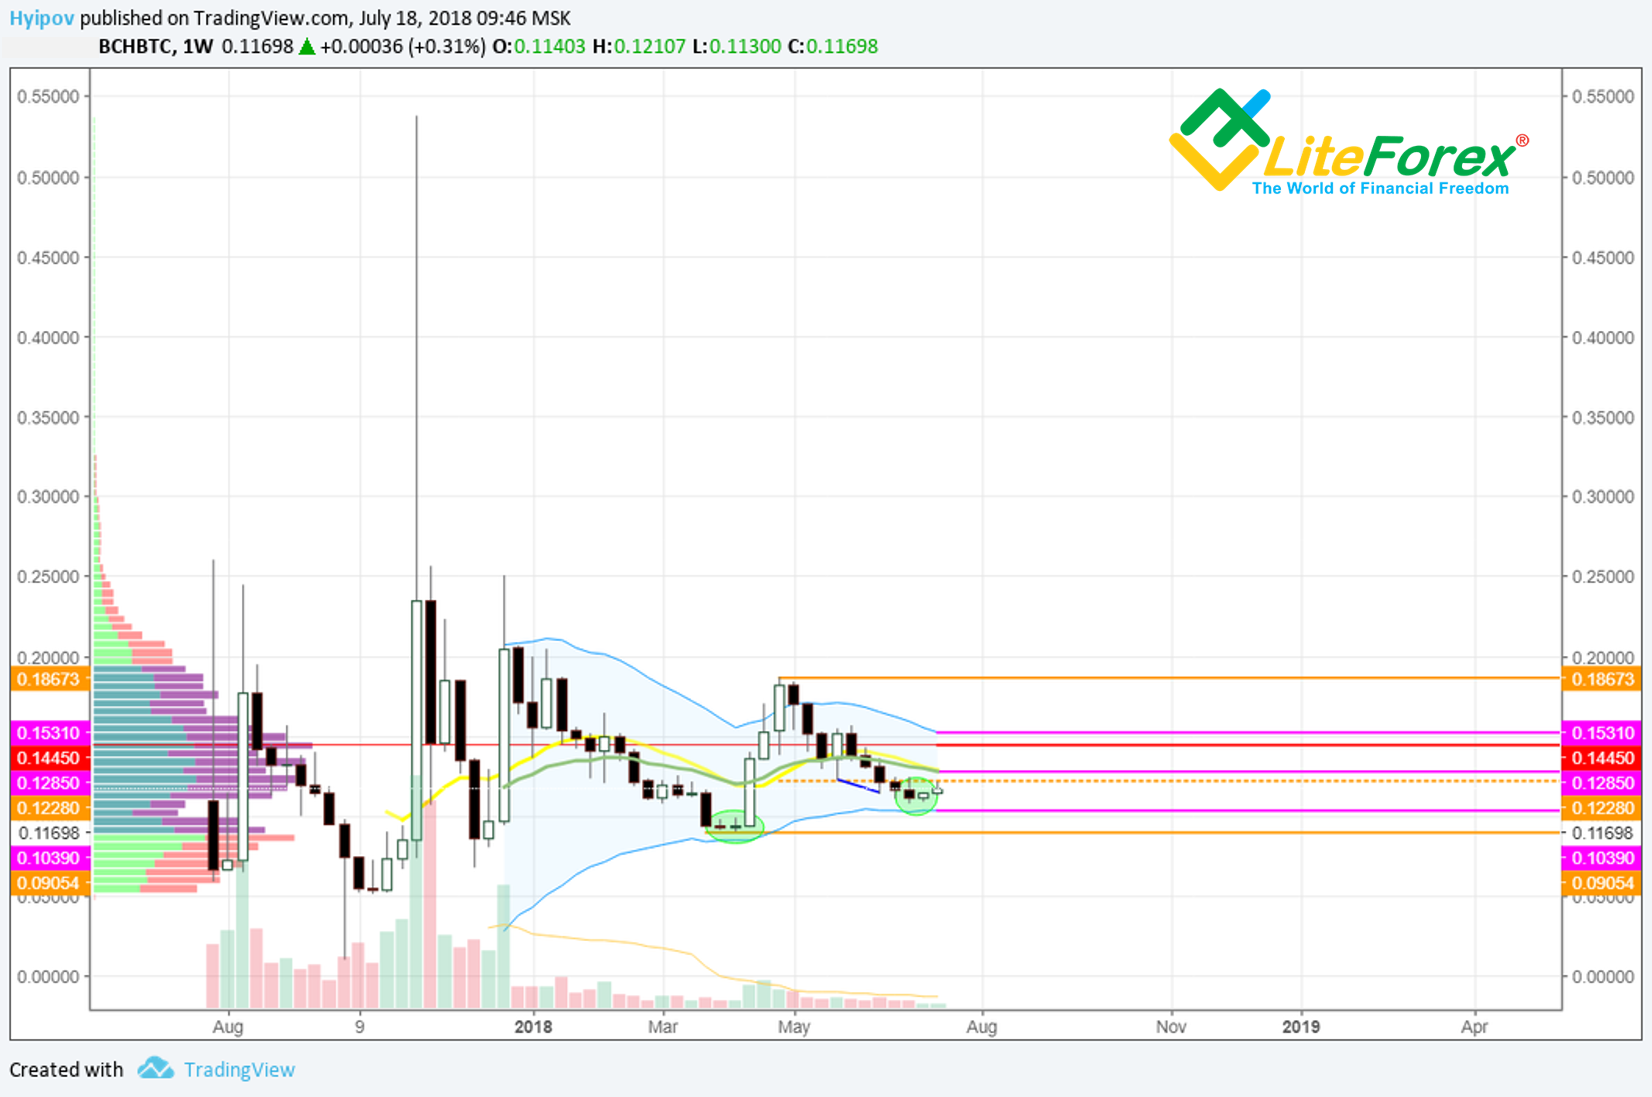
It is clear in the BCH price chart above, in the BCH 1W timeframe, the price didn’t touched Keltner channel’s bottom border at 0.1039 BTC. The BCH price drew a rounding and a hint at the BCH price reversal.
As it is clear from the history, the price didn’t touched the level as well last time (marked with the green circles), and so, the price can well reverse upwards.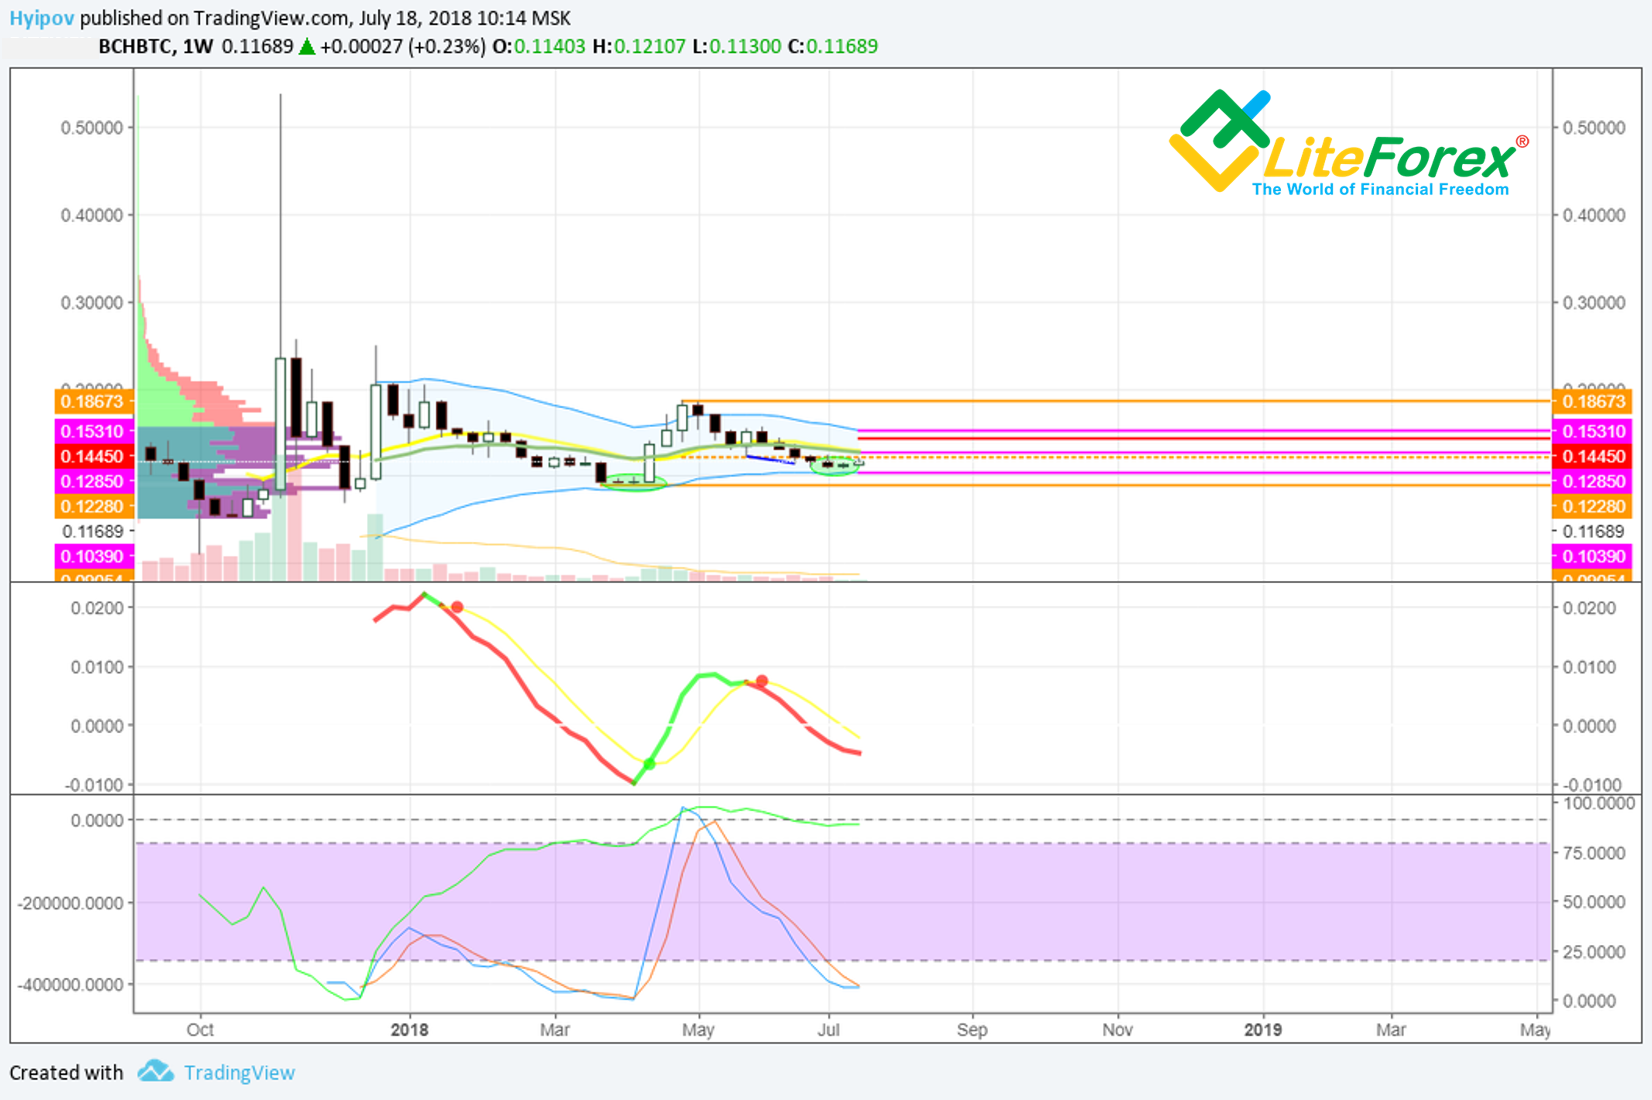
Oscillators in the BCH weekly chart don’t provide anything clear. Both MACD and RSI stochastic are in the oversold zone. There no obvious pivot signals, no divergence as well. So, based on these indicators, BCHBTC can dive deeper.
Graphic analysis proves the possibility of the short-term rebound.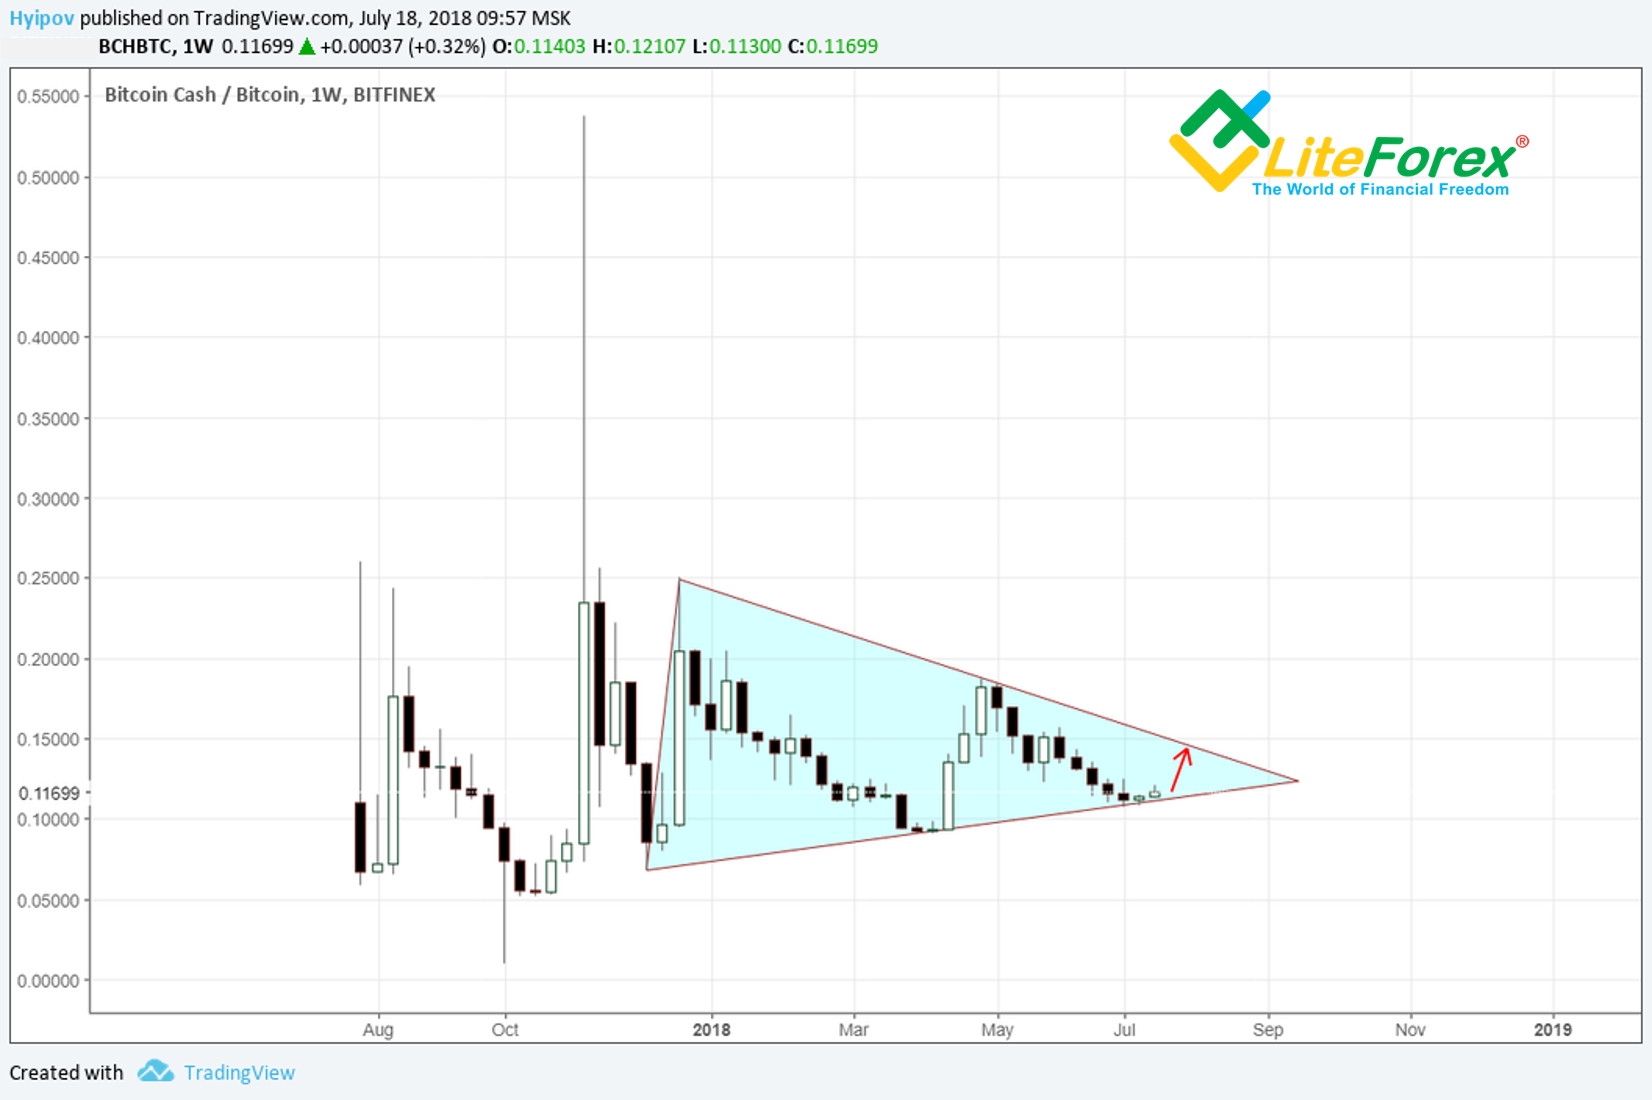
In the weekly timeframe (see BCH price chart above) there is clear consolidation and a triangle developing. Now, the BCH ticker is at the triangle’s upper border, which increases the chances for BCH price rebound. The upper leg border is around 0.13 – 0.15 BTC (according to the time of the price moving towards the triangle’s top leg).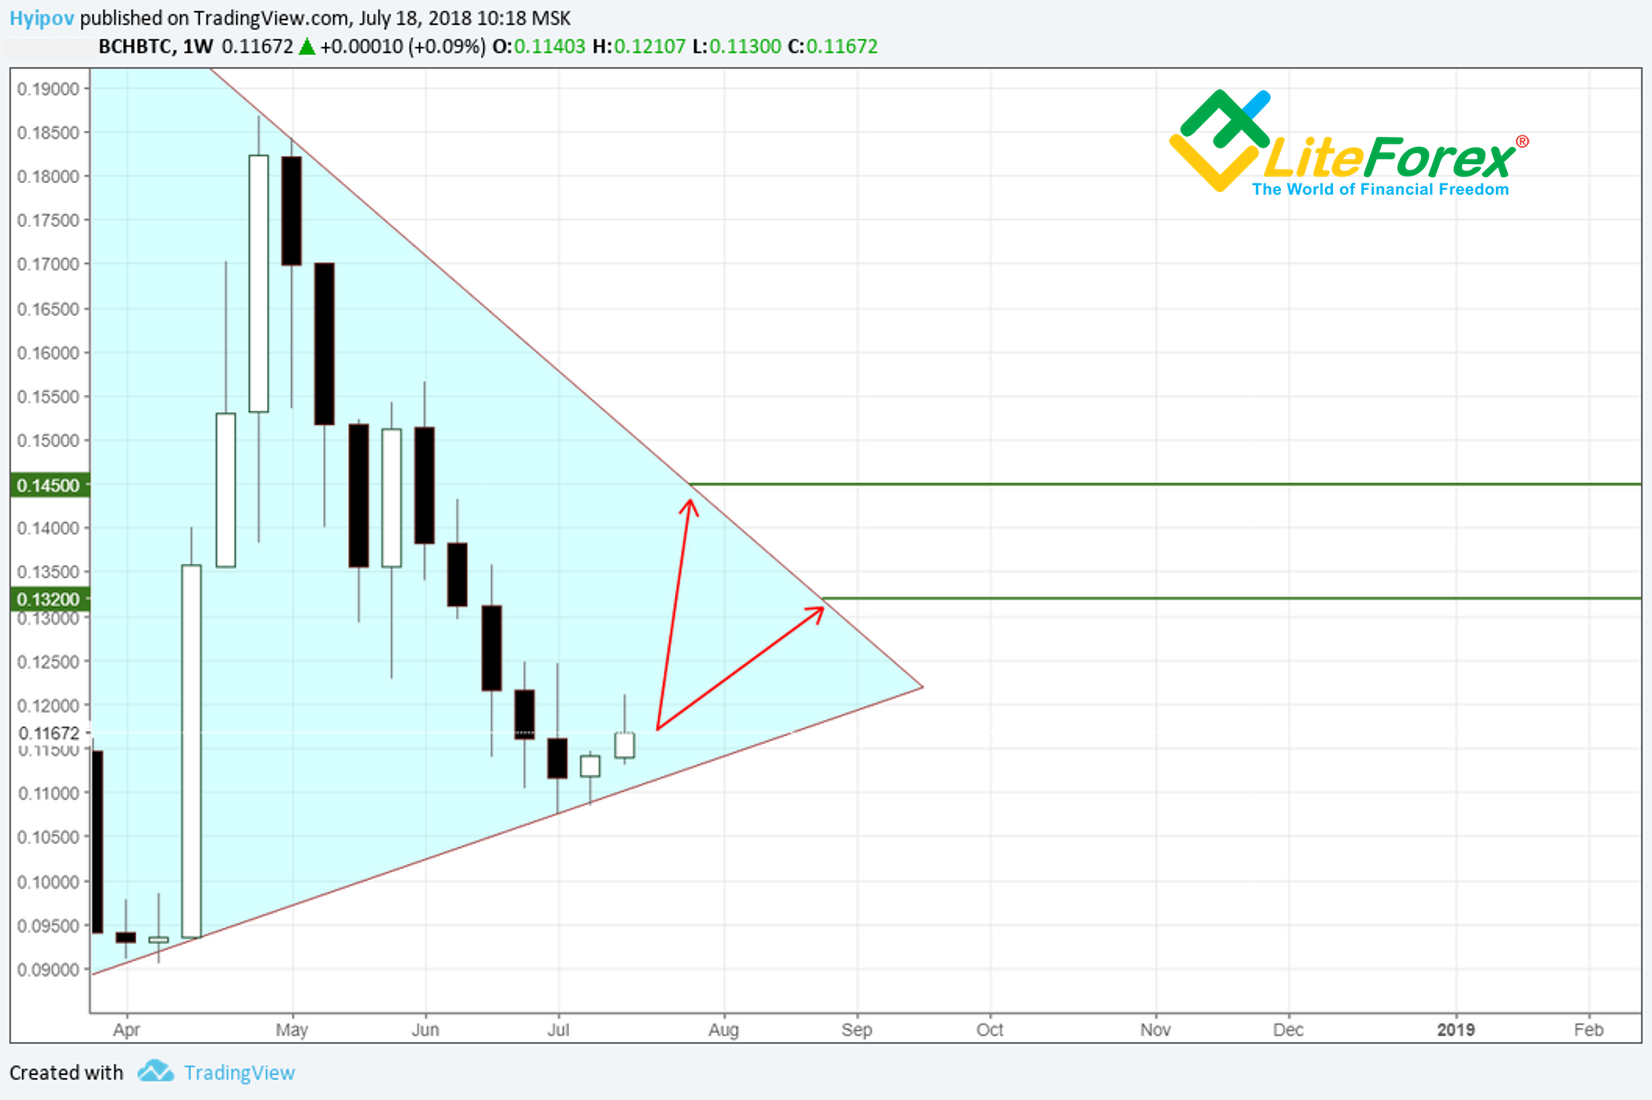
Finally, I suggest the situation in the BCH 1W timeframe be neutral, a little bit bullish, due to BCH graphic analysis results.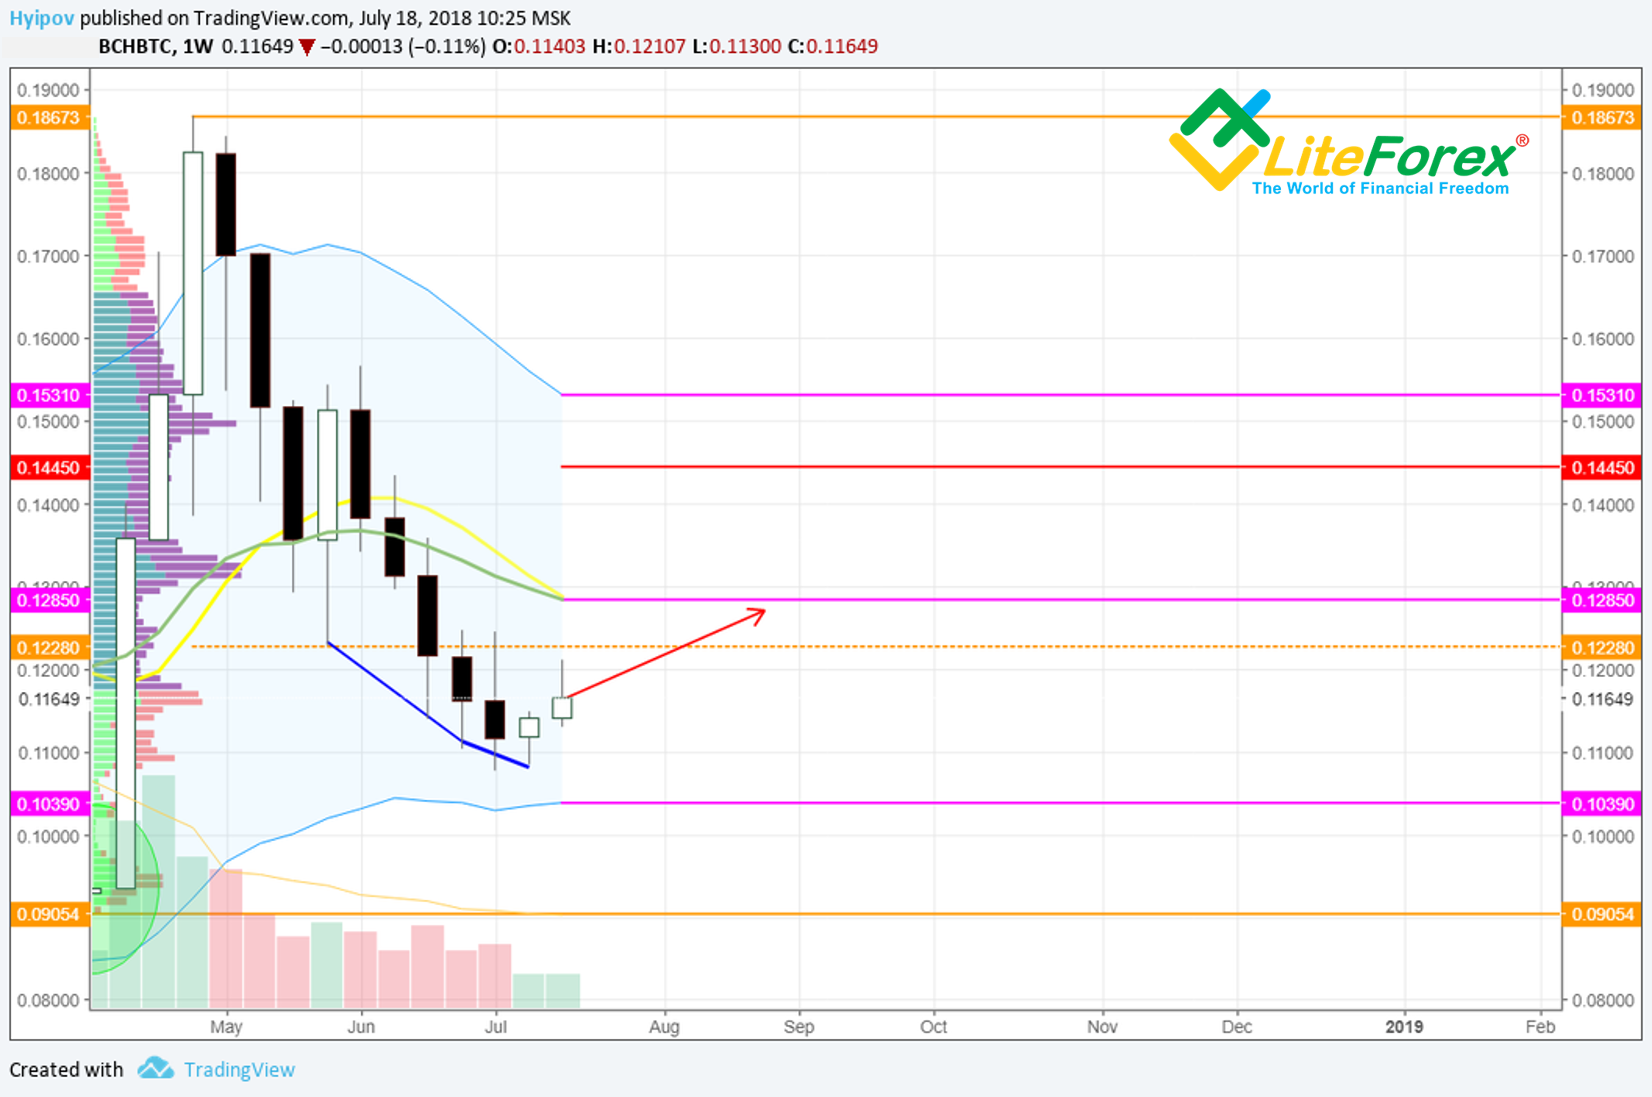
So, the target in the weekly timeframe is near Keltner channel’s balance level at 0.128. As the triangle top border should be at round this level by late August, the BCH price grows more likely to move up to the level.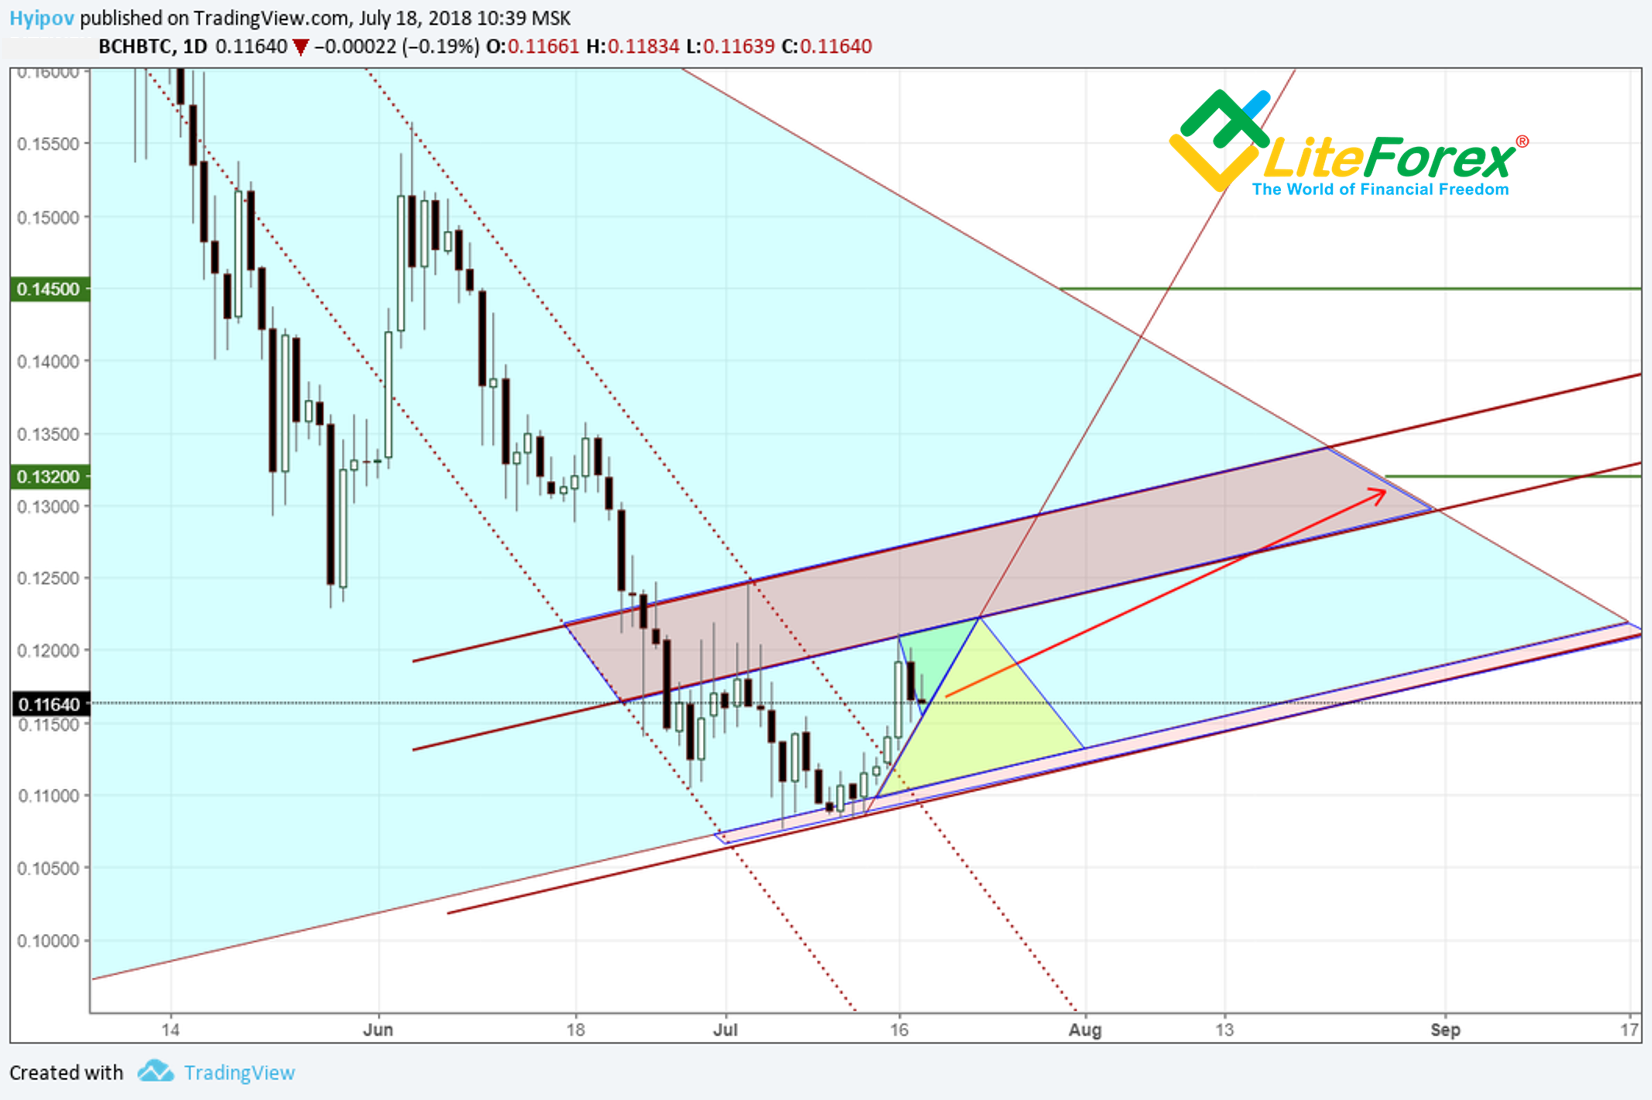
Applying the trendline analysis in BCH 1D chart, it is clear that the ticker got out of the bearish trend and the sentiment has changed.
Now BCH is moving in the sideways trend that is ascending. From above, there is a wide resistance zone (marked with red). The ticker is going towards it in the bullish micro-correction. The space for moving is strongly limited by the green zone. Moving outside the micro-trend will enable manipulators to add more purchases (I marked it with yellow). If BCH ticker moves below the channel bottom border and break the triangle from above the market sentiment will change the BCH local trend will reverse downwards.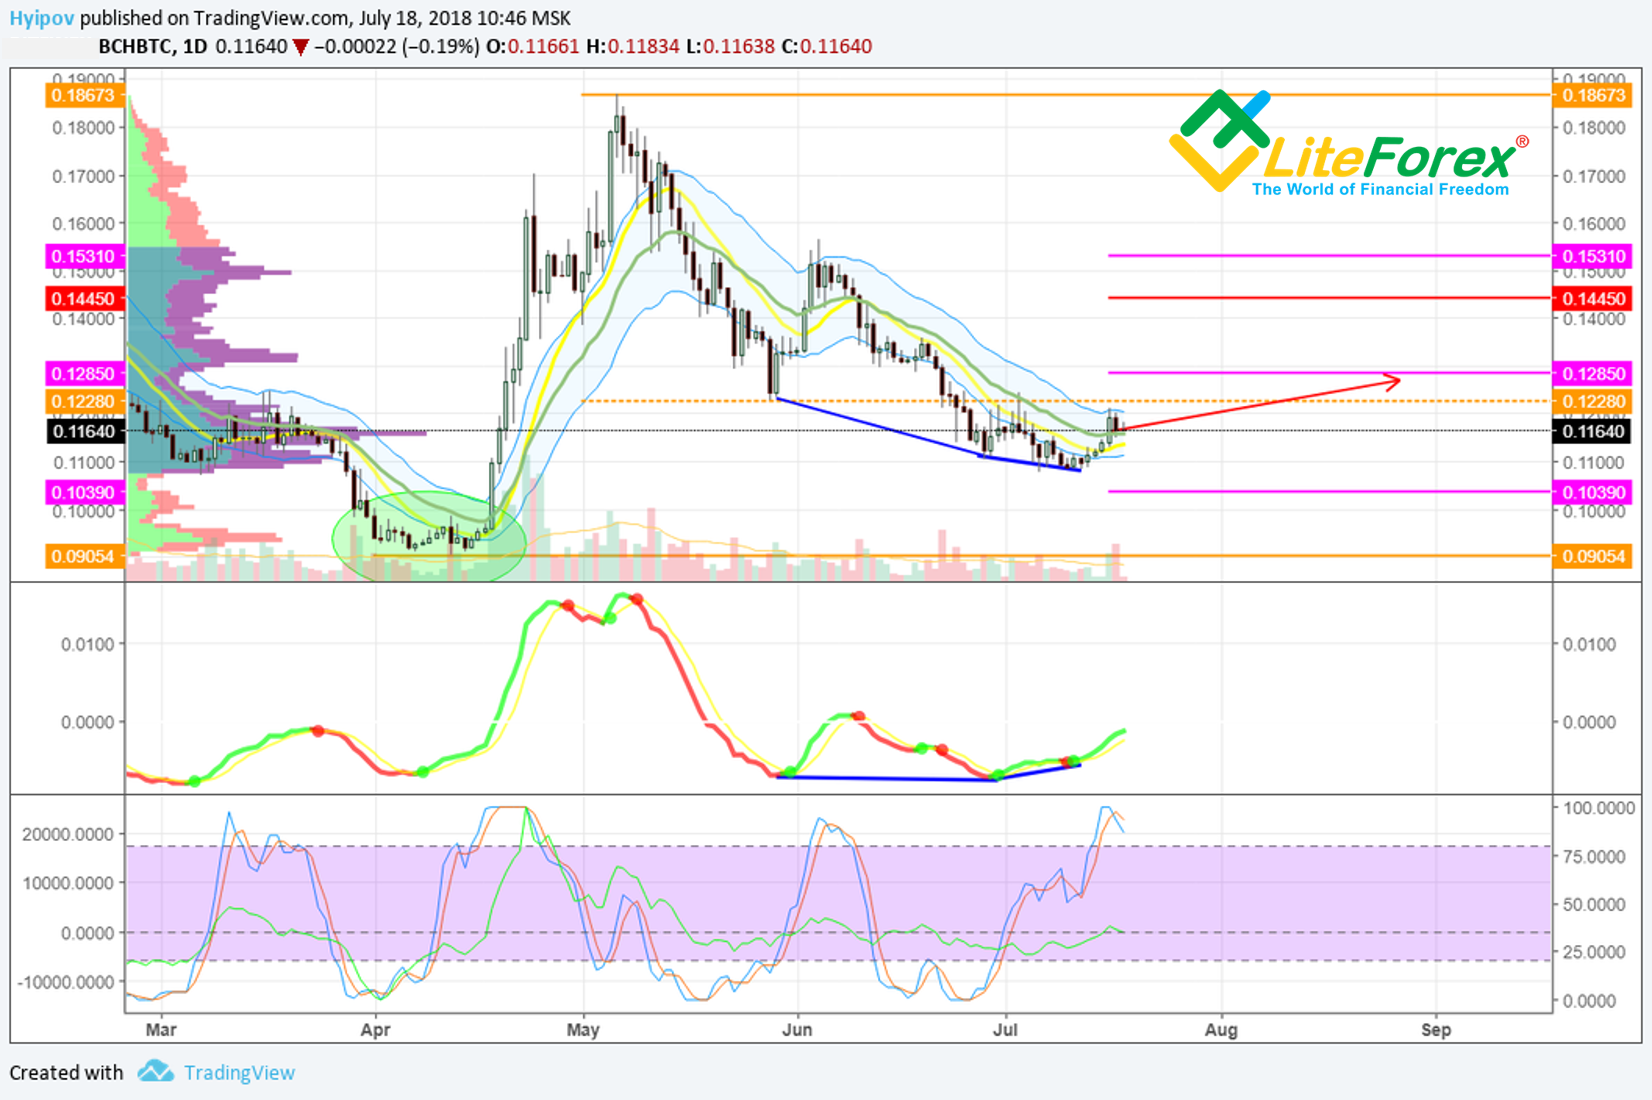
In BCH 1-day timeframe, oscillators indicate a whole series of bullish convergences, which suggest a possible upward moving. In general, the last short growth wave, results from these signals; however the RSI overbought signal indicates that this wave is rather limited and the ticker can slide down into the sideways trend.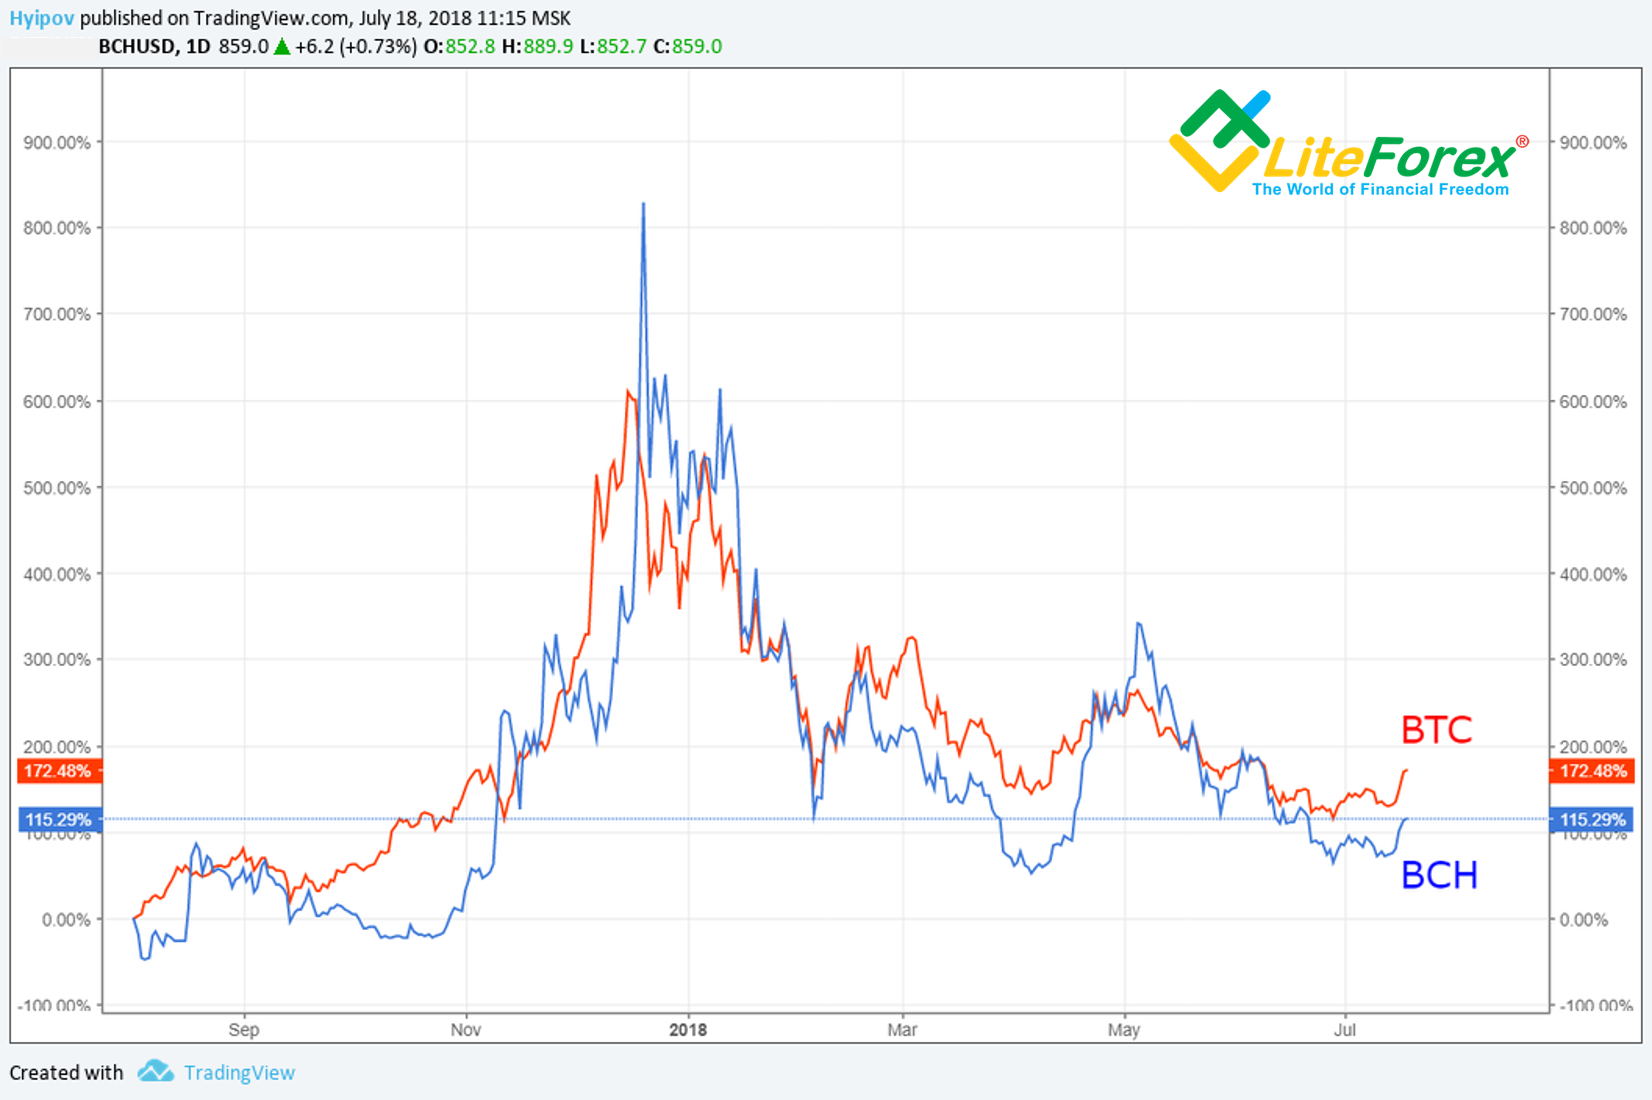
In my BCH analysis, I often compare BCH with Bitcoin. The matter is that BitCash often follows BTC moves with a wider swings range. So, in this case, it is important to find out how Bitcoin is doing and what it is promising in future.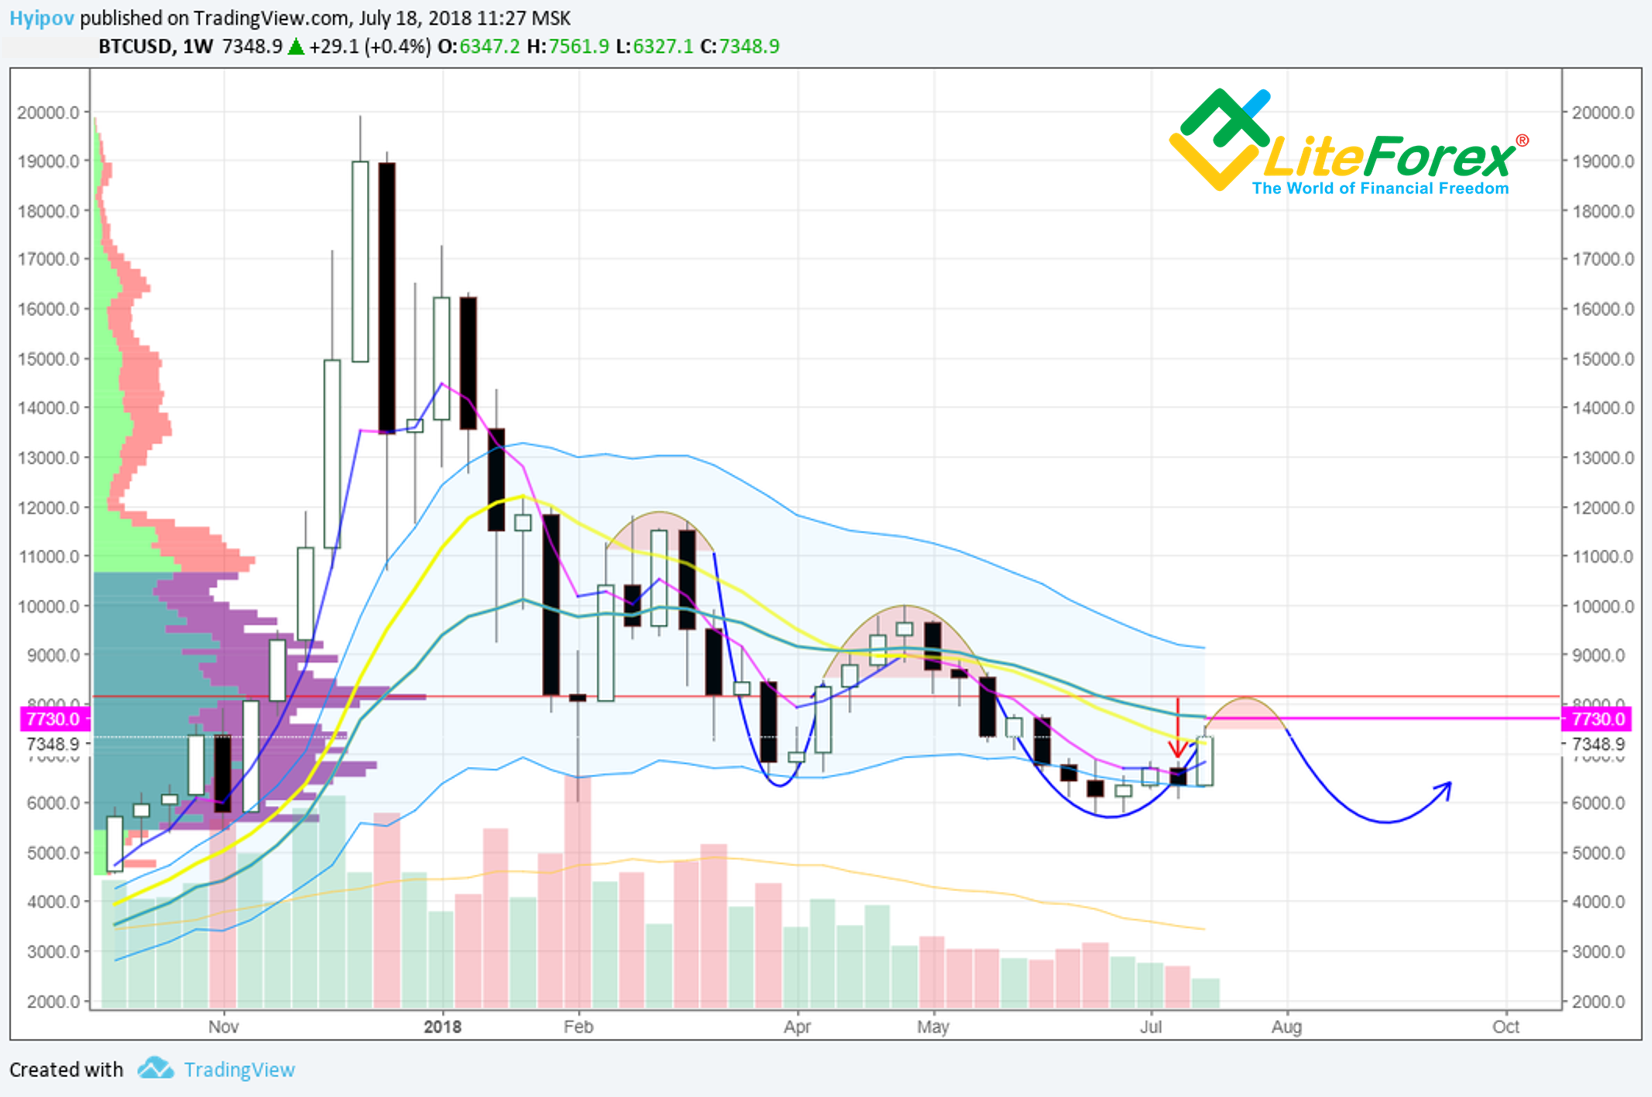
Frankly speaking, the yesterday’s BTC/USD surge surprised me.
The momentum, we witnessed, didn’t fit into either technical analysis or the manipulators’ logic, I suggested as the main scenario. In the chart above, there is a red candlestick under the red arrow, which covered the body of the previous candlestick's body and renewed the lows in the weekly chart.
Such signals won’t certainly suggest a surge, so I was rather skeptic about this BTC surge and treated it as trap for bulls. But manipulators don’t observe the laws, they play their own game.
If we try to predict the BTC future moves, now we have a clear target-magnet at 8000 USD. That is where manipulators should be aiming at, and the crowd of hamsters, witnessing the sharp BTC price rise, will start buying out bitcoins in panic. This level will locate large walls of sell orders. Manipulators are aiming to break the wall and trigger the stop losses, so a short tail, followed 8000 is quite possible. At present, many are writing that they've fixed their positions for Bitcoin and exited the cryptocurrency, but there is not an obvious drawdown in BTC price chart.
There is strong support that can push the market higher, so it is risky to go short now. On the other hand, to believe in Bitcoin price rise is to obey big players. You see, that all altcoins to Bitcoin are in the red zone, so Bitcoin is growing not because of the market factors, but because of the internal driver. It is a short-term event that can’t continue for a long time, so, you mustn’t believe in Bitcoin further strong growth.
Summary
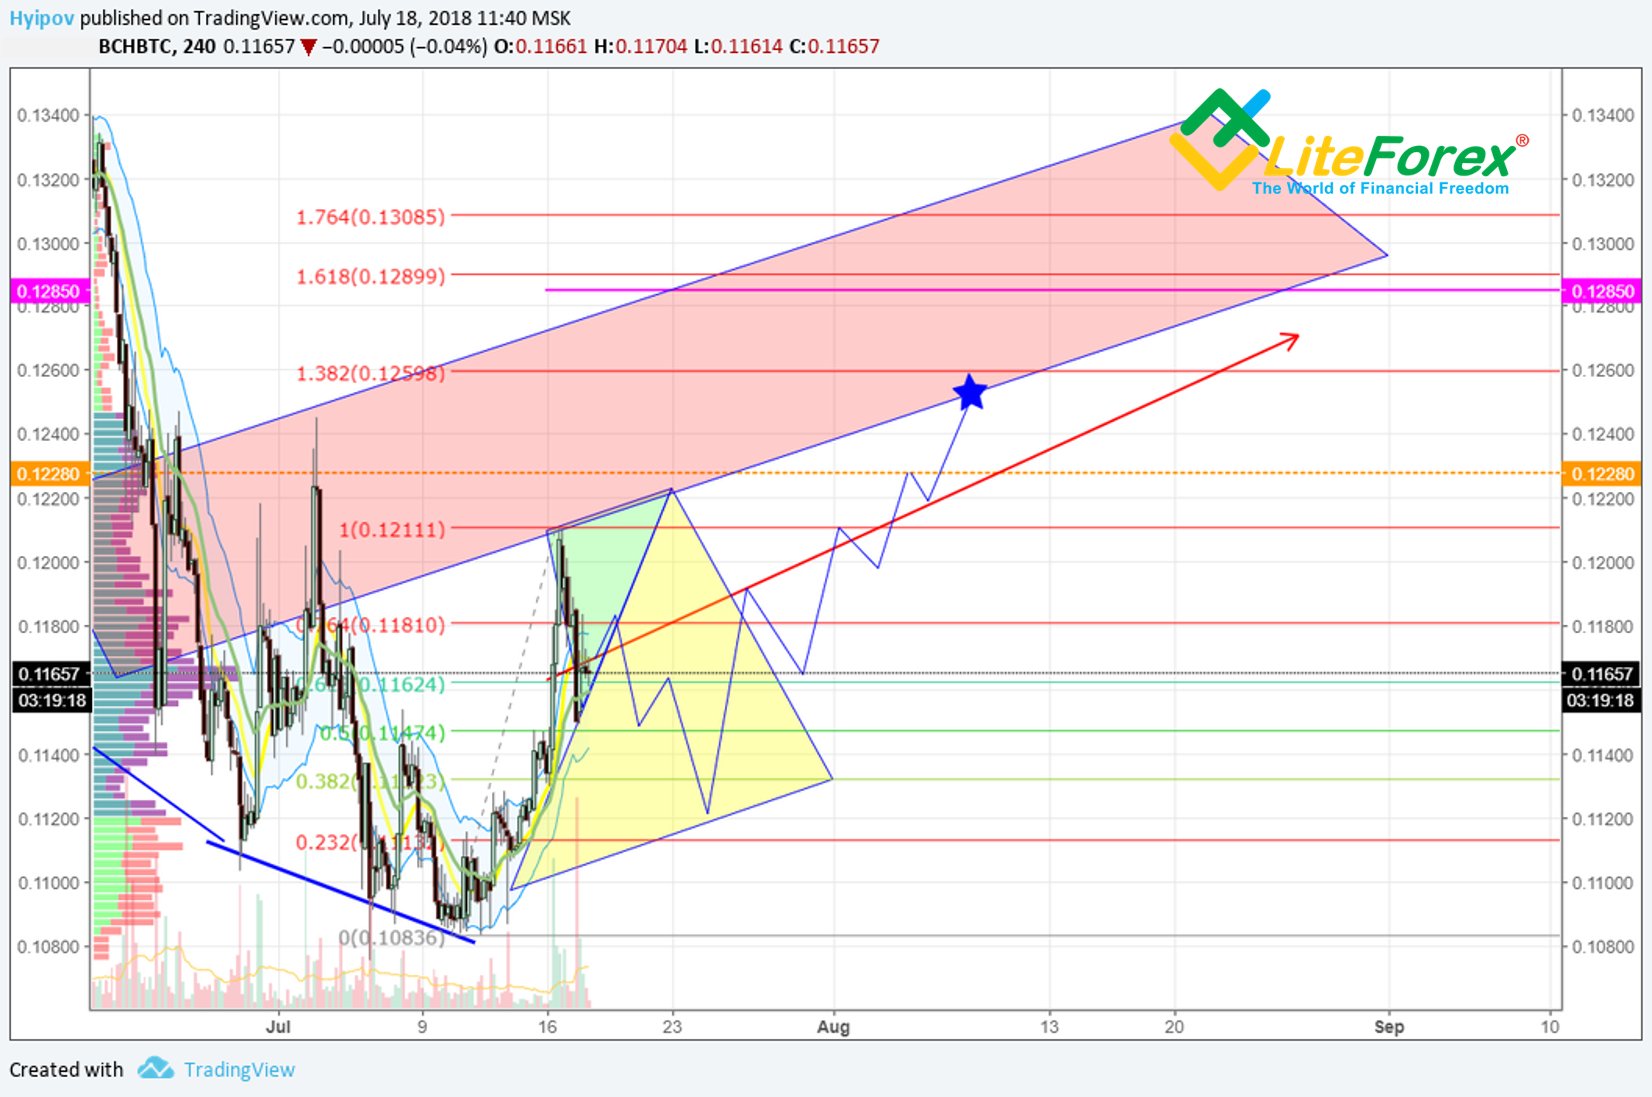
Bitcoin, going on resisting bears, is likely to draw a part of capitalization form other altcoins; therefore BCH price is likely to be corrected against Bitcoin. It is a paradox that, following such a sharp rise in Bitcoin price, its correction will badly affect altcoins; so, BVH can well test levels around 0.11 BTC before late August.
Moving lower will cancel the scenario and I shall revise my forecast.
Finally, Bitcoin Cash is likely to fall into manipulators’ zone (yellow triangle), where they will be able to accumulate positions for the next pump.
Form above, the growth is limited by the wide resistance zone (marked with the red zone), and so, I suggest the nearest upward targets be not higher than 0.1228 BTC – 0.126 BTC.
According to Bitcoin Cash fundamental analysis, BTC situation is not very positive; and it is going to be a strong deterrent. If the information background is growing more negative, BCH price may go even lower, towards its all-time lows. Therefore, if you go long, yo must put a stop below 0.11 BTC
That is my BCH/BTC updated scenario.
I wish you good luck and good profits!
