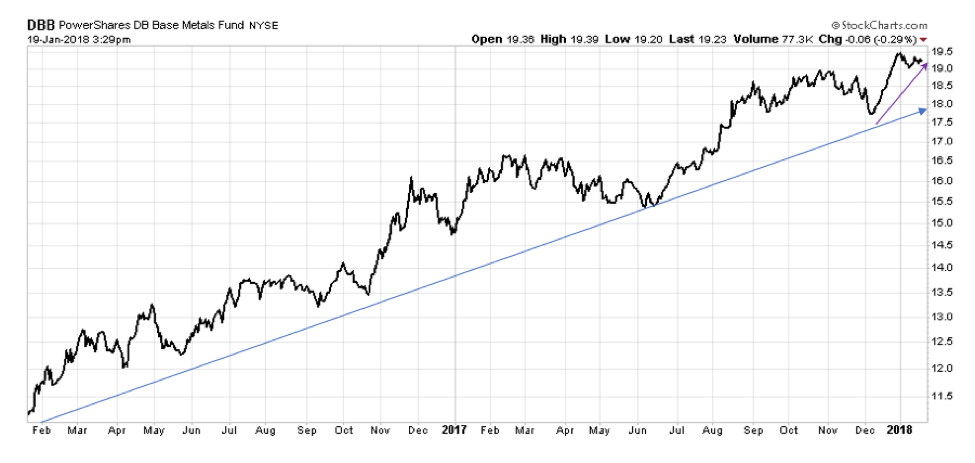
The base metal trendline appears to have shifted sideways this month after skyrocketing at the end of 2017. Market observers can take comfort knowing that after a meteoric rise, it takes time for the price to “digest” previous gains.

Source: MetalMiner analysis of StockCharts
Base metals prices remain in a more than two-year uptrend, and both base metals and steel seem to have additional upward momentum. MetalMiner expects more movement to the upside this year.
Some analysts have suggested a possible peak for base metals this year. When markets change from bullish to bearish, prices tend to move in a sideways trend. However, macroeconomics do not support the bearish case. For example, copper could face a double supply disruption caused by Chilean copper mines and the opaque supply chain of the scrap sector.
Despite the possibility that the base metals rally could actually have started to peak, the evidence of the bulls still seems to outweigh the case for the bears. No current indicators signal the end of this bullishness for base metals.
Instead, some of the warning signals tracked by MetalMiner strongly support a sustained bullish future for base metals.
The U.S. Dollar
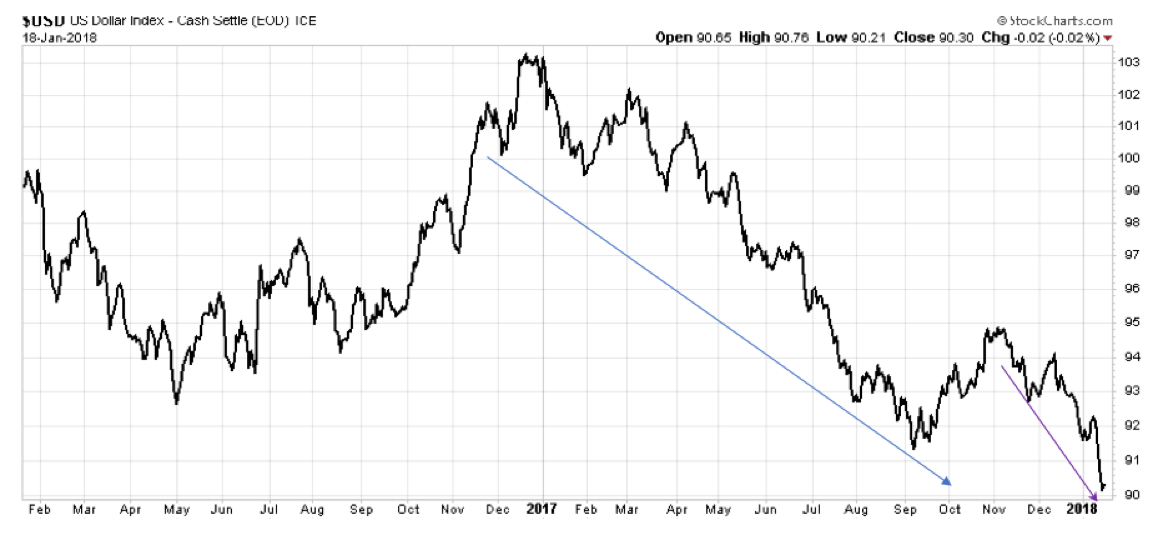
The U.S. dollar fell to a more than three-year low this month. The U.S. dollar fell below previous minimums, which also suggests weakness. A weaker U.S. dollar typically correlates with a bullish market for both commodities and base metals. Therefore, this seems like a strong supportive fact for base metals in 2018.

Source: MetalMiner analysis of StockCharts
Commodities
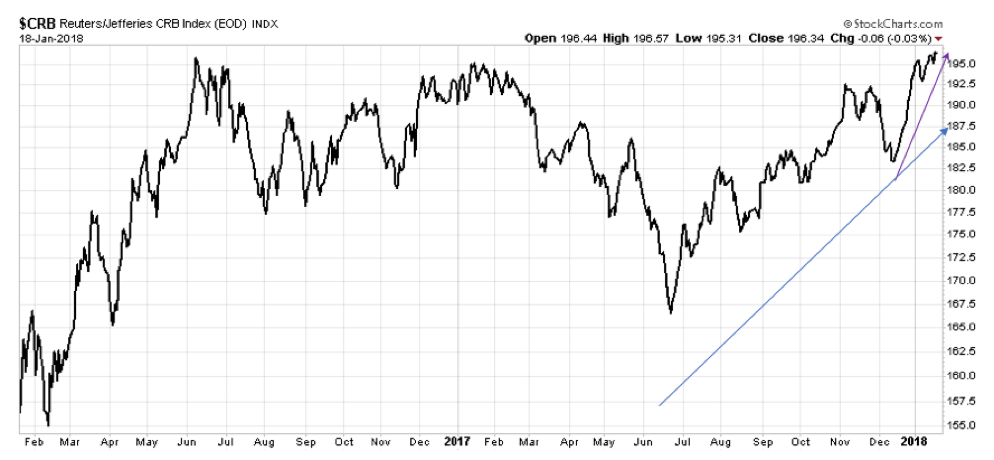
Similar to base metals, commodities also traded more sideways this month than they did in December. However, we would expect this movement because the CRB index skyrocketed in December.

Source: MetalMiner analysis of StockCharts
Oil prices, which make up one of the largest elements of the CRB index, remain in a strong uptrend since June. Oil prices breached our long-term resistance level in November and climbed further in both December and January. Crude oil prices, currently around $63/barrel, could continue to climb this year.
What This Means for Industrial Buyers
In December, buying organizations had some opportunities to buy some volume before base metals skyrocketed. With January’s slower price momentum, buying organizations may still want to identify appropriate price signals to better plan purchases.
