The last time we wrote about Bank of America (NYSE:BAC) was on October 18th, 2018. The stock was trading below $29 a share, down from the $33.05 top reached in March.
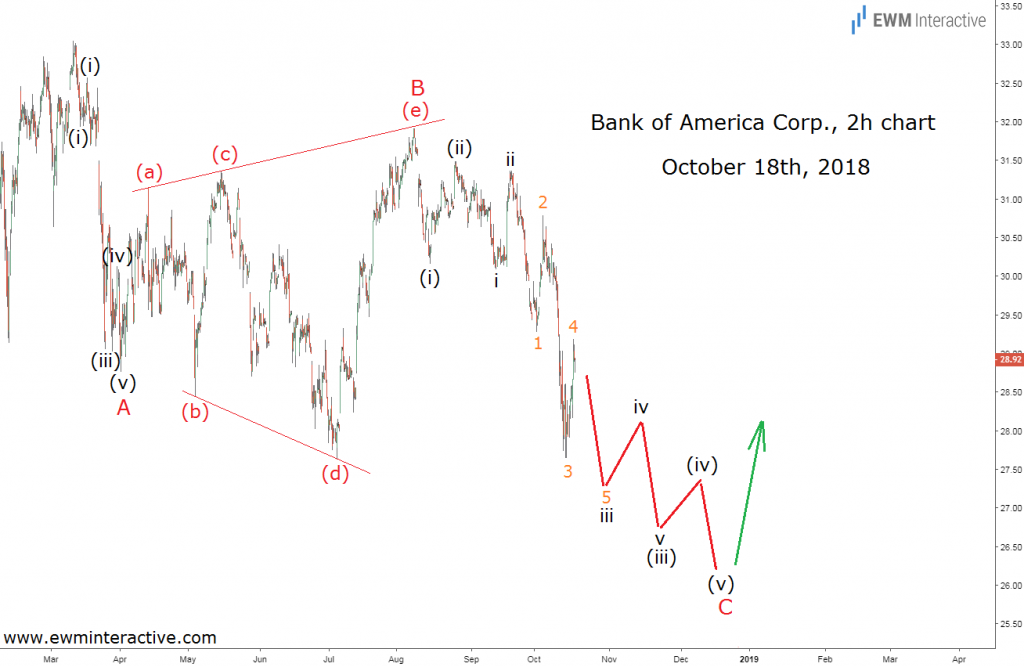
The bank had just reported a record first quarter, but the stock price was falling nevertheless. So in order to make sense of it, we turned to Elliott Wave analysis of BAC’s 3-hour chart, shown below.
The chart revealed that the decline from $33.05 was a simple A-B-C zigzag correction with an expanding triangle in wave B and wave C still under construction. This meant more weakness could be expected in wave C, but a bullish reversal should be expected as soon as it ended.
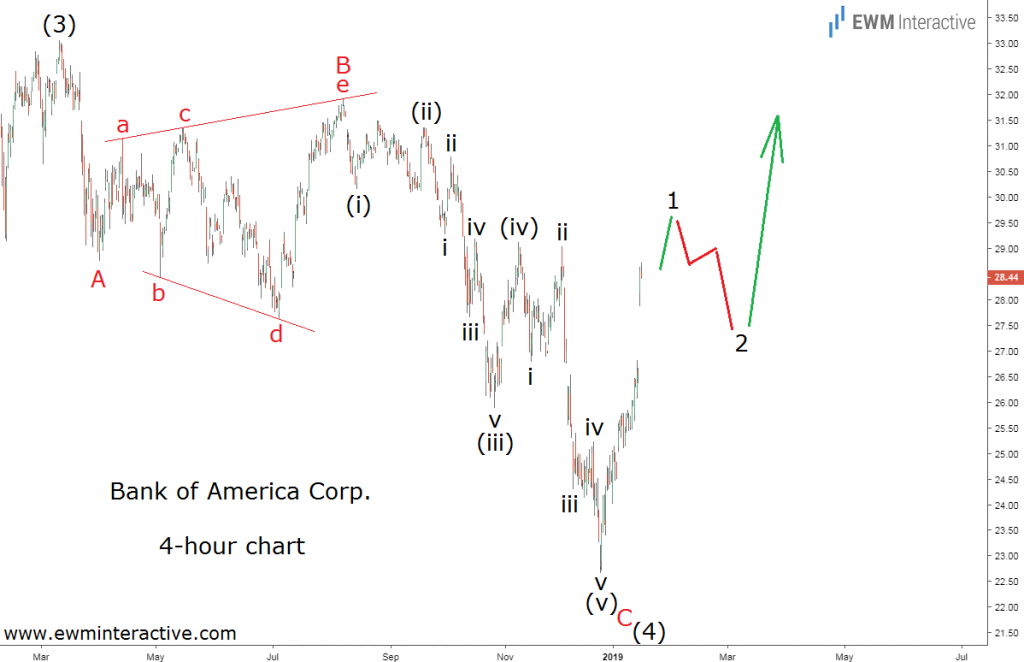
In terms of price, we thought “BAC may slide to $26 – $25 a share, before the situation starts to improve.” The bulls actually took the wheel at $22.66 on December 24th.
Yesterday, the stock rose by over 7% and closed at $28.45. This time, the market’s reaction to Bank of America’s record Q4 report was unanimously positive.
The fact that the bullish reversal occurred over 20 days ago once again proves that “the habit of the market is to anticipate, not to follow.” The market was anticipating investors’ positive reaction to the bank’s earnings report.
Now, once a correction is over, the larger trend resumes. BAC was clearly in an uptrend prior to March, 2018, and the decline from $33.05 to $22.66 is corrective. So, we can expect this positive reaction to continue and eventually lift the stock to a new high.
Bank of America – The Bigger Picture
However, in less than a year Bank of America demonstrated that record profits don’t always translate into a rising stock price. Besides, simply extrapolating the current trend of rising earnings into the future to justify higher prices can be very dangerous. That is how stock market bubbles form.
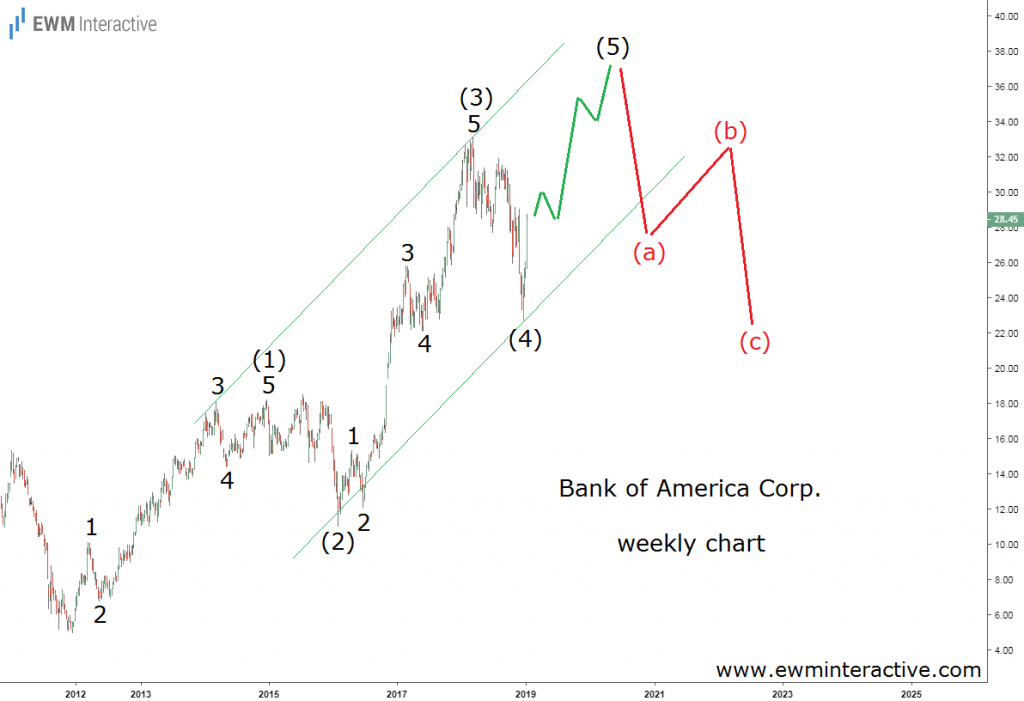
That is why we need to put the recent price action into proper context. The weekly chart below shows where the plunge to $22.66 fits into the big picture.
The weekly chart reveals the structure of BAC’s recovery from as low as $4.92 in December, 2011. It can easily be seen as a five-wave impulse, developing within the parallel lines of a trend channel, whose wave (5) has just begun. The five sub-waves of waves (1) and (2) are also clearly visible.
According to the Elliott Wave theory, every impulse is followed by a three-wave correction in the opposite direction. If this count is correct, wave (5) can be expected to lift Bank of America stock to the area between $35 and $40 a share.
Investors are likely going to keep riding this earnings-inspired rally for a while. On the other hand, once wave (5) exceeds the top of wave (3), we should be very careful. The support area of wave (4) near $23 would be a natural target for the anticipated three-wave correction.
2018 was the best year in Bank of America’s history, but the stock finished the year down 17% anyway. Remember that when everything looks rosy near the top of wave (5).


