Earnings season starts to pick up the pace this week, with reports from JPMorgan Chase & Co. (NYSE:JPM) and Wells Fargo & Company (NYSE:WFC) scheduled before market open on Tuesday, Jan. 15.
Between the Fed’s rate-hike path, growing concerns regarding global economies and future growth, and geopolitical uncertainty, there’s plenty for executives to discuss on tomorrow’s earnings calls.
Beyond whether the banks beat, meet, or miss projections, it could be interesting to tune in to earning’s calls to see whether executives discuss their outlook for interest rates. The yield on the 10-year Treasury has pulled back to well under the key 3% rate as investors have sought the relative safety of U.S. government debt. At the same time, there have been worries about the potential inversion of the yield curve, an out-of-the-ordinary formation that has preceded recessions in the past.
In addition to interest rate movement, global uncertainty regarding economic growth and geopolitics has been a regular topic in recent quarterly calls. Still, executives haven’t seemed too worried yet that any of it might start to dampen loan and deposit growth in the immediate future.
At an Axios event recently, JPM CEO Jamie Dimon said “2019 could be the fastest global growth year on record,” although he did mention that a slowdown in 2020 seemed likely. The International Monetary Fund expects global growth to come in at 3.7% in 2019, lower than their previous 3.9% estimate. The World Bank is less optimistic, expecting global growth to slow to 2.9% this year.
JP Morgan Earnings And Options Activity
For Q4, JPM is expected to report EPS of $2.25 on revenue of $27.28 billion, according to third-party consensus analyst estimates. In the same quarter last year, EPS came in at $1.76 on revenue of $25.45 billion.
When JPM last reported, net revenue from its consumer and community banking operations increased 10% year over year (YoY), to $13.29 billion. Within that segment, consumer and business banking grew 18% to $6.4 billion; and the card, merchant services and auto division increased 10% to $5.6 billion. Analysts are again widely expecting similar strength from this division.
Where there is some uncertainty is how the corporate and investment bank division performed in Q4. In Q3, JPM reported revenue in this segment increased 2% YoY to $8.81 billion, but was down 11% compared to the second quarter, when the company reported $9.9 billion in revenue in that division. JPM reported that fixed income markets revenue declined 10% YoY to $2.8 billion in Q3, which wasn’t offset by a 17% increase in equity markets revenue. Given the heightened volatility across many asset classes in Q4, it remains to be seen how that impacted trading operations, as well as debt and equity underwriting.

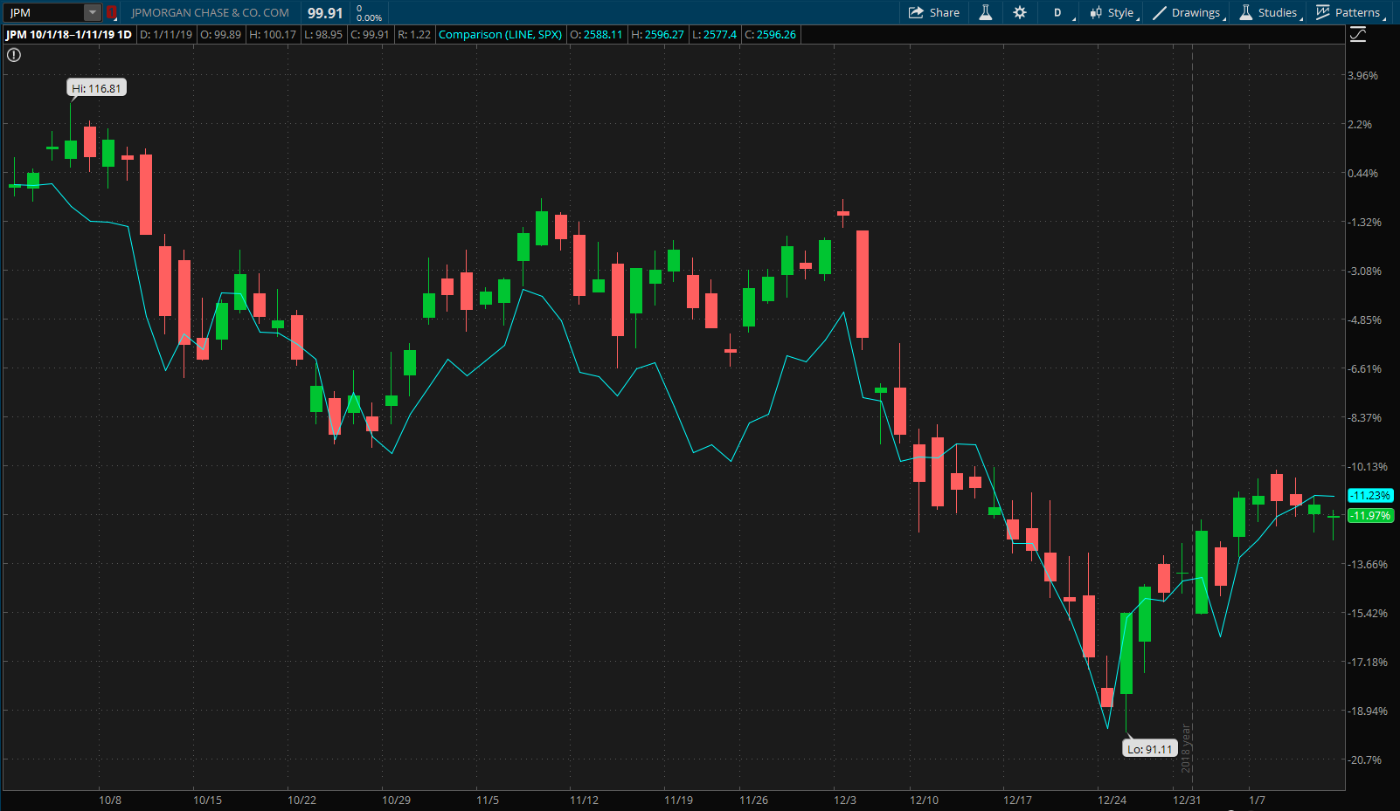
In Line With S&P 500. JPM is charted above, compared to the S&P 500 (SPX, teal line). The two have been moving pretty closely in line with each other since the start of October. Since the start of Q4, JPM is down 11.97%, versus the SPX’s 11.23%, as of January 14. Chart source: thinkorswim® by TD Ameritrade. Not a recommendation. For illustrative purposes only. Past performance does not guarantee future results.
Options traders have priced in a 2.8% stock price move in either direction around JPM’s earnings release, according to the Market Maker Move indicator on the thinkorswim® platform. Implied volatility was at the 42nd percentile as of this morning.
In short-term trading at the Jan. 18 monthly expiration, calls have been active at the 100 and 105 strike prices. On the put side, most of the activity has been at the 100 strike, pretty much right at the money. The 95-strike has had heavier volume in recent trading as well.
Looking at the Feb. 15 monthly expiration, trading has been concentrated similarly to January. For calls, activity has been heavier at the 100 and 105 strikes, while puts have been active at the 95 and 100 strikes.
Note: Call options represent the right, but not the obligation, to buy the underlying security at a predetermined price over a set period of time. Put options represent the right, but not the obligation to sell the underlying security at a predetermined price over a set period of time.
Wells Fargo Earnings And Options Activity
In tomorrow’s report, WFC is expected to report EPS of $1.19, up from $0.97 in the prior-year quarter, on revenue of $21.75 billion, according to third-party consensus analysts. Revenue is projected to decrease 1.4% compared to last year.
Right now, many analysts have been focused on CEO Tim Sloan’s efforts to strengthen the bank and address some of the issues that has plagued it in recent years. Since 2016, the bank has faced one scandal after another, to the point that the Federal Reserve ordered it to keep its assets under $1.95 trillion until it has demonstrated improved governance and controls.
Sloan’s update last quarter was just that the company’s interactions with regulators had been constructive, and that the bank was still planning on operating under the asset cap in the first part of 2019.
As the Fed has handicapped WFC’s growth, management has taken steps to cut expenses and improve the efficiency of the bank. On last quarter’s earnings call, CFO John Shrewsberry said WFC was still on track to achieve its $53.5 to $54.5 billion expense target this year. Next year the bank is targeting $52 to $53 billion in total expenses, and by 2020 expects to be able to reduce it even further to $50 to $51 billion.
Due to the company’s focus on efficiency, combined with expanding digital self-service options available to customers, management had said it’s expecting headcount reductions of 5% to 10% over the next three years, both through layoffs and regular employee attrition.
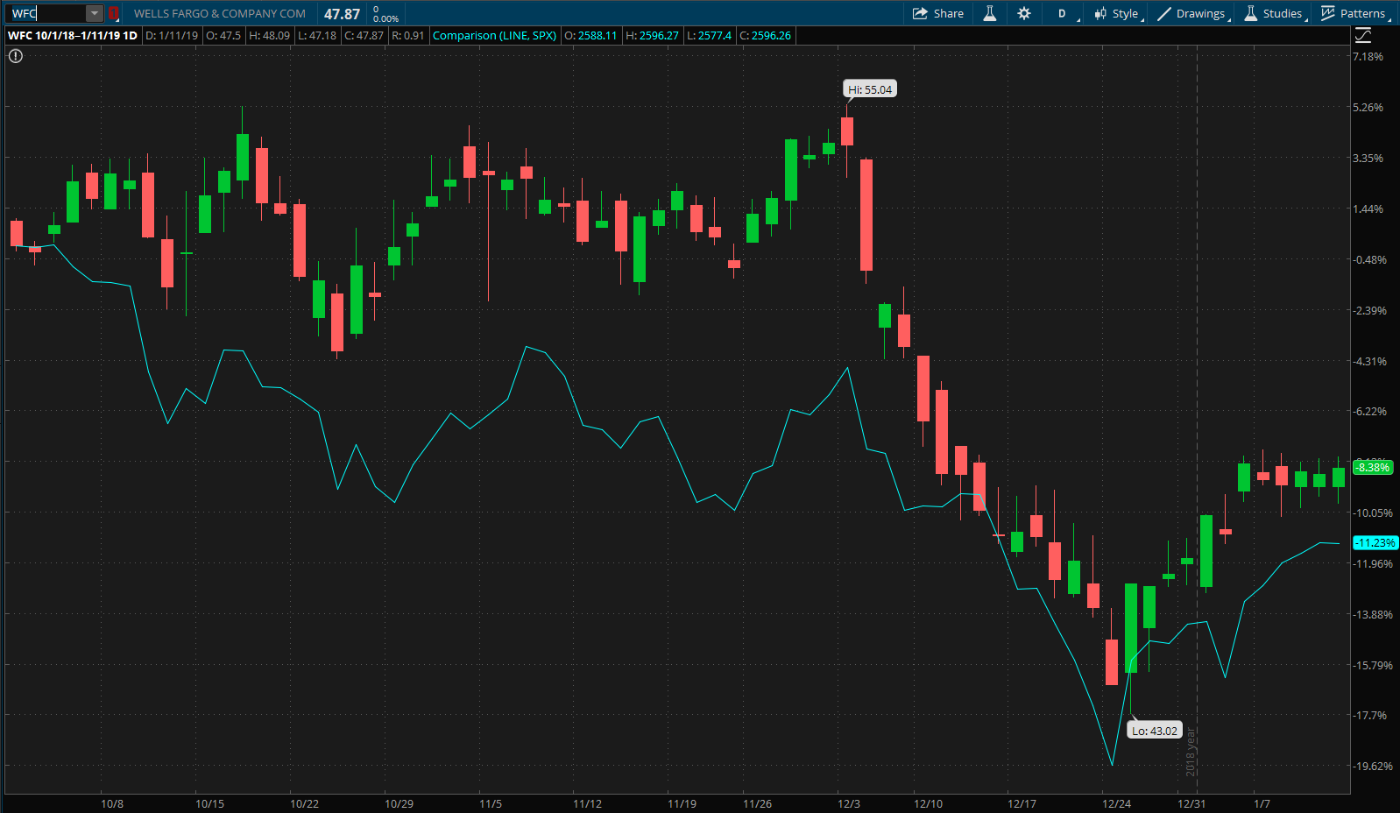
Wells Fargo Since Start of Q4. WFC has bounced back since the end of September and, even though it’s down 8.38% since the start of October, has been outpacing the S&P 500 (SPX, teal line), which is down 11.23% over the same time frame. Chart source: thinkorswim® by TD Ameritrade. Not a recommendation. For illustrative purposes only. Past performance does not guarantee future results.
Around WFC’s earnings report, options traders have priced in a 4% stock move in either direction, according to the Market Maker Move indicator. Implied volatility was at the 44th percentile as of this morning.
At the Jan. 18 monthly expiration, the 50-strike call has been heavily traded, with volume of 3,076 contracts during Friday’s session and open interest of 24,398 contracts. On the call side, the 47 and 48 strikes have also been active. For puts, activity has been concentrated at the 47 strike. There is also a significant amount of open interest ranging from about 52,000 contracts to 67,000 contracts at the 45, 50 and 52.5-strike puts.
Further out at the Feb. 15 monthly expiration, volume has been heavier recently on the call side, with the most activity at the 50-strike call. For puts, there has been a smattering of activity mostly right around the money.
TD Ameritrade® commentary for educational purposes only. Member SIPC. Options involve risks and are not suitable for all investors. Please read Characteristics and Risks of Standardized Options.

