
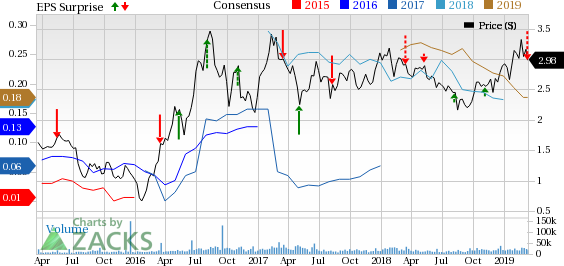
B2Gold Corp (NYSE:BTG) reported adjusted net income of $14 million or a penny per share in fourth-quarter 2018 compared with $6 million or a penny per share recorded a year ago. Earnings per share missed the Zacks Consensus Estimate of 2 cents.
Including one-time items, the company recorded a loss of $50 million or 6 cents per share compared with net income of $34 million or 3 cents per share in the prior-year quarter.
The company recorded revenues of $272 million in the fourth quarter, up 56.3% from the year-ago period. The figure beat the Zacks Consensus Estimate of $271 million.
B2Gold Corp Price, Consensus and EPS Surprise
Operational Update
B2Gold’s consolidated gold production was 231,687 ounces in the reported quarter, a year-over-year decline of 3.7%. Production for the quarter modestly exceeded the company’s reforecast production and was in line with budget.
The Fekola Mine produced 105,280 ounces of gold in the reported quarter, exceeding original budget.
The company reported consolidated cash operating costs of $523 per ounce in the fourth quarter, reflecting a year-over-year increase of 10.5%. Consolidated all-in sustaining costs (AISC) of $814 per ounce came in 8% higher than the year-ago quarter.
Financial Position
B2Gold’s cash and cash equivalents were $103 million at the end of 2018 compared with $147 million as of Dec 31, 2017. The company recorded operating cash flow of $74 million for the fourth quarter compared with $26 million reported in the year-earlier quarter.
The company repaid its $259-million aggregate principal amount of convertible senior subordinated notes on Oct 1, 2018. At the end of 2018, the company’s outstanding total debt had reduced to around $480 million from $700 million at the beginning of the year.
2018 Results
B2Gold reported adjusted net income of $162 million or 16 cents per share in 2018 compared to the prior year’s $52 million or 5 cents. Earnings marginally missed the Zacks Consensus Estimate of 17 cents. Including one-time items, the company recorded net income of $45 million or 3 cents per share compared with prior year’s net income of $62 million or 6 cents.
The company generated revenues of $1.22 billion in 2018, up a whopping 92% year over year. However, the top-line missed the Zacks Consensus Estimate of $1.24 billion.
In 2018, the company recorded annual consolidated gold production of 953,504 ounces, which is near the higher end of the revised guided range of 920,000-960,000 ounces. Production was up 51% year over year.
Outlook
For 2019, the Masbate Mine is expected to produce between 200,000 and 210,000 ounces of gold, up from the previous guidance of 180,000-190,000 ounces. Further, for the full year, Fekola's gold production is projected to be between 420,000 and 430,000 ounces (previous guidance was 400,000-410,000 ounces).
Moreover, B2Gold expects to continue its strong operational and financial performance from existing mines in the current year. It envisions consolidated gold production of between 935,000 and 975,000 ounces for 2019. Cash operating costs are forecast in the range of $520-$560 per ounce and AISC is predicted in the band of $835-$875 per ounce for 2019.
The company also hopes to generate $370 million cash flow from operations in 2019. It will focus on growth through the expansion of mines, as well as exploration and development of the existing projects while reducing debt levels.
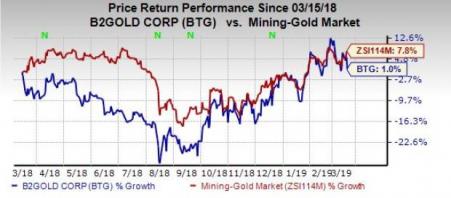
Share Price Performance
Over the past year, B2Gold has gained 1% compared with the industry’s gain of 7.8%.
Zacks Rank and Stocks to Consider
B2Gold currently carries a Zacks Rank #3 (Hold).
A few better-ranked stocks in the Basic Materials sector are Ingevity Corporation (NYSE:NGVT) , Innospec Inc. (NASDAQ:IOSP) and Materion Corporation (NYSE:MTRN) , each sporting a Zacks Rank #1 (Strong Buy). You can see the complete list of today’s Zacks #1 Rank stocks here.
Ingevity has an expected earnings growth rate of 17.9% for 2019. The company’s shares have rallied 38.1%, over the past year.
Innospec has a projected earnings growth rate of 3.5% for the current year. The stock has appreciated 20.1% in a year’s time.
Materion has an estimated earnings growth rate of 12.6% for 2019. The company’s shares have gained 7.7%, in the past year.
Today's Best Stocks from Zacks
Would you like to see the updated picks from our best market-beating strategies? From 2017 through 2018, while the S&P 500 gained +15.8%, five of our screens returned +38.0%, +61.3%, +61.6%, +68.1%, and +98.3%.
This outperformance has not just been a recent phenomenon. From 2000 – 2018, while the S&P averaged +4.8% per year, our top strategies averaged up to +56.2% per year.
See their latest picks free >>
Innospec Inc. (IOSP): Free Stock Analysis Report
Ingevity Corporation (NGVT): Free Stock Analysis Report
B2Gold Corp (BTG): Free Stock Analysis Report
Materion Corporation (MTRN): Free Stock Analysis Report
Original post
Zacks Investment Research