
Avery Dennison Corporation (NYSE:AVY) reported adjusted earnings of $1.72 per share in second-quarter 2019, surpassing the Zacks Consensus Estimate of $1.68. The figure also increased around 3.6% year over year.
Including one-time items, the company posted net income of $1.69 per share compared to the year-ago quarter’s earnings per share of $1.07.
Total revenues declined 3.2% year over year to $1.79 billion, missing the Zacks Consensus Estimate of $1.83 billion. Organic sales growth came in at 1.6% in the reported quarter.
Cost of sales in the quarter was down 3% year over year to $1.31 billion. Gross profit slipped 3.8% year over year to $482.3 million. Gross margin edged down to 26.8% from 27% the prior-year quarter.
Marketing, general and administrative expenses came in at $265.7 million compared with $287.5 million reported in the year-ago quarter. Adjusted operating profit came in at $216.6 million, up from the $213.9 million recorded in the prior-year quarter. Adjusted operating margin inched up to 12.1% from the year-earlier quarter’s 11.5%.
Avery Dennison Corporation Price, Consensus and EPS Surprise
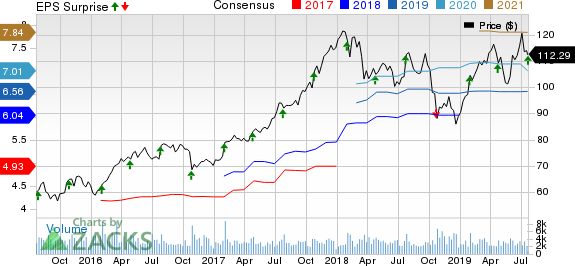
Avery Dennison Corporation price-consensus-eps-surprise-chart | Avery Dennison Corporation Quote
Segmental Performance
Revenues in the Label and Graphic Materials segment declined 4.1% year over year to $1,206.3 million. On an organic basis, sales grew 0.9%. Adjusted operating profit decreased 3.9% year on year to $166.5 million.
Revenues in the Retail Branding and Information Solutions segment inched up 0.4% year over year to $418.3 million. On an organic basis, sales were up 4.4%, primarily driven by continued strength in sales of radio frequency identification (RFID) solutions. The segment’s adjusted operating income increased 11.5% to $52.1 million.
The Industrial and Healthcare Materials segment reported net sales of $171.1 million, dropping 5% from the prior-year quarter. The segment reported adjusted operating income of $17.9 million compared with $16.8 million recorded in the comparable quarter last year.
Financial Updates
Avery Dennison had cash and cash equivalents of $247.3 million at the end of the second quarter, up from $215.8 million reported at the end of the year-ago quarter. The company generated $203.4 million in cash from operating activities in the reported quarter compared with $193.5 million reported in the year-earlier period.
During the April-June quarter, Avery Dennison repurchased 0.3 million shares for a total cost of $27.9 million. The company’s share count decreased 3.8 million in the quarter.
Avery Dennison’s long-term debt increased to $1,503.3 million as of Jun 29, 2019, compared with $1,289.7 million as of Jun 30, 2018.
Cost-Reduction Activities
Avery Dennison realized approximately $12 million in pre-tax savings from restructuring in the second quarter. The company incurred pre-tax restructuring charges of approximately $8 million.
Guidance
For 2019, Avery Dennison tightened its adjusted earnings per share guidance of $6.50-$6.65. Including the impact of the pension-settlement charge, Avery Dennison tightened the earnings per share guidance to $3.15-$3.30 from the prior estimate of $3.10-$3.35, maintaining the mid-point of its guidance.
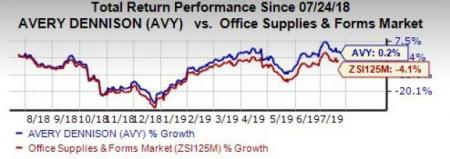
Share Price Performance
Shares of Avery Dennison have gained 0.2% over the past year, outperforming the industry’s loss of 4.1%.
Zacks Rank and Stocks to Consider
Avery Dennison currently carries a Zacks Rank #3 (Hold).
Some better-ranked stocks in the Industrial Products sector are Roper Technologies, Inc. (NYSE:ROP) , John Bean Technologies Corp. (NYSE:JBT) and CECO Environmental Corp. (NASDAQ:CECE) , each sporting a Zacks Rank #1 (Strong Buy), at present. You can see the complete list of today’s Zacks #1 Rank stocks here
Roper Technologies has an estimated earnings growth rate of 9.8% for the ongoing year. The company’s shares have gained 31.9% in the past year.
John Bean Technologies has an expected earnings growth rate of 5.9% for the current year. The stock has appreciated 29.2% in a year’s time.
CECO Environmental has an impressive projected earnings growth rate of 84.8% for 2019. The company’s shares have rallied 31.3% over the past year.
Today's Best Stocks from Zacks
Would you like to see the updated picks from our best market-beating strategies? From 2017 through 2018, while the S&P 500 gained +15.8%, five of our screens returned +38.0%, +61.3%, +61.6%, +68.1%, and +98.3%.
This outperformance has not just been a recent phenomenon. From 2000 – 2018, while the S&P averaged +4.8% per year, our top strategies averaged up to +56.2% per year.
See their latest picks free >>
Roper Technologies, Inc. (ROP): Free Stock Analysis Report
John Bean Technologies Corporation (JBT): Free Stock Analysis Report
Avery Dennison Corporation (AVY): Free Stock Analysis Report
CECO Environmental Corp. (CECE): Free Stock Analysis Report
Original post
Zacks Investment Research