
Avanos Medical, Inc. (NYSE:AVNS) reported adjusted earnings of 30 cents per share in fourth-quarter 2018, which surpassed the Zacks Consensus Estimate of 24 cents. However, the metric plunged 58.9% year over year.
For 2019, the company expects adjusted earnings between $1.15 and $1.35 per share. The mid-point of $1.25 is below the Zacks Consensus Estimate of $1.29. Following the earnings announcement, shares of this Zacks Rank #4 (Sell) company decreased 14.6%, to close at $43.12 on Mar 11.
Revenues totaled $169.9 million, which missed the Zacks Consensus Estimate of $166 million but increased 2.2% on a year-over-year basis.
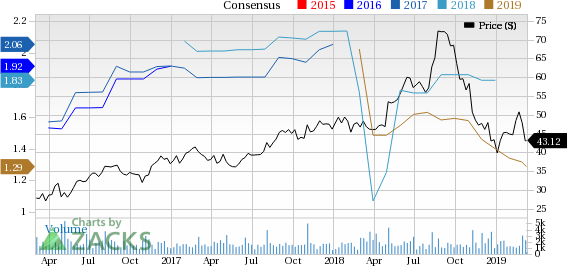
AVANOS MEDICAL, INC. Price and Consensus
2018 at a Glance
Net revenues in 2018 amounted to $652.3 million, up 6.7% on a year-over-year basis.
Chronic Care revenues were $386 million, up 7% year over year. The segment accounted for 59.2% of net revenues.
Pain Management revenues were $266.3 million, up 6.2% year over year. The segment accounted for 40.8% of net revenues.
Q4 Segmental Analysis
Chronic Care
Net revenues at this segment summed $98.2 million, up 3.7% year over year. However, distributors within Chronic Care held an elevated level of inventory in the Digestive Health product unit by the end of the fourth quarter.
Pain Management
The segment posted net revenues of $71.7 million. The metric inched up 0.1% on a year-over-year basis.
Margin Analysis
Adjusted gross profit came in at $102.7 million, up 13% from the prior-year quarter figure. Adjusted gross margin was 60.4% of net revenues, up 570 basis points (bps) year over year.
Research and development expenses totaled $10.6 million, down 12.4% year over year. Selling, general and administrative expenses amounted to $87.9 million, up 13.6% year over year.
Adjusted operating profit in the fourth quarter was $20 million, skyrocketing 203% on a year-over-year basis. Adjusted operating margin in the quarter was 11.8% of net revenues, up from 4% in the year-ago quarter.
Guidance
Avanos expects 2019 net revenues to increase 6-8% year over year, on a constant-currency basis (including Game Ready). Overall, the company expects savings in the range of $7-$10 million for 2019. With the establishment of the IT infrastructure, the company projects additional savings of $14-$18 million in 2020.
Avanos expects Chronic Care segment to grow in mid-single digits. The company also expects to launch multiple new products in the segment to maintain its leading share position.
The company also plans to invest in its market-leading CORTRAK tube-tracking technology to establish it as the standard of care for bed-side placement of small-bore nasoenteric feeding tubes.
During the first half of 2019, Avanos expects six-month results from the hyaluronic acid study and the health economic study.
In 2019, Avanos plans to make huge investments (most of which will happen during the first half of the year). During the first quarter, the company is expected to expand its COOLIEF direct-to-patient television advertising into new markets. Overall, its investments for the first half of 2019 are expected to exceed investments in the second half of the year.
Earnings of MedTech Majors at a Glance
Some better-ranked MedTech stocks that delivered solid results in the respective quarters are Varian Medical Systems (NYSE:VAR) , AngioDynamics (NASDAQ:ANGO) and CONMED Corporation (NASDAQ:CNMD) .
Varian reported first-quarter fiscal 2019 adjusted earnings per share (EPS) of $1.06, in line with the Zacks Consensus Estimate. Revenues of $741 million outpaced the consensus mark of $717.9 million. The stock has a Zacks Rank #2 (Buy).
AngioDynamics’ second-quarter fiscal 2019 adjusted EPS of 22 cents exceeded the Zacks Consensus Estimate by a penny. Revenues totaled $91.5 million, which surpassed the consensus estimate by 2.9%. The stock carries a Zacks Rank #2. You can see the complete list of today’s Zacks #1 Rank (Strong Buy) stocks here.
CONMED delivered fourth-quarter 2018 adjusted EPS of 73 cents, in line with the Zacks Consensus Estimate. Revenues of $242.4 million outshined the Zacks Consensus Estimate of $229.2 million. The stock carries a Zacks Rank of 2.
Today's Best Stocks from Zacks
Would you like to see the updated picks from our best market-beating strategies? From 2017 through 2018, while the S&P 500 gained +15.8%, five of our screens returned +38.0%, +61.3%, +61.6%, +68.1%, and +98.3%.
This outperformance has not just been a recent phenomenon. From 2000 – 2018, while the S&P averaged +4.8% per year, our top strategies averaged up to +56.2% per year.
See their latest picks free >>
Varian Medical Systems, Inc. (VAR): Free Stock Analysis Report
AngioDynamics, Inc. (ANGO): Free Stock Analysis Report
CONMED Corporation (CNMD): Free Stock Analysis Report
AVANOS MEDICAL, INC. (AVNS): Free Stock Analysis Report
Original post
Zacks Investment Research