The U.S. dollar continued to remain strong across its peers on Wednesday. Economic data showed that the consumer prices in the Eurozone came out as expected. Headline inflation was seen rising 1.2% while core inflation rate was registered at 0.7%, marking a slower increase in core CPI. German inflation was flat during the month.
Data from the U.S. showed that building permits increased 1.35 million matching the median estimates while data for March was revised slightly higher to 1.38 million. Housing starts were however a tad weaker, rising 1.29 million which was below estimates of 1.32 million. The U.S. industrial production report showed an increase of 0.7% beating estimates of a 0.6% increase.
Looking ahead, the economic calendar for the day is relatively quiet. Earlier in the Asian session, Australia released its unemployment figures. The Australian unemployment rate was seen rising to 5.6% against estimates of an unchanged print at 5.5%. However, the economy was seen adding a healthy 22k jobs during the month which was above estimates.
In the European trading session, the economic data is relatively quiet. The U.S. trading session will see the release of the Philly Fed Manufacturing index and the weekly unemployment claims data. Later in the evening, the BoE chief economist, Andy Haldane is expected to speak.
EUR/USD intra-day analysis

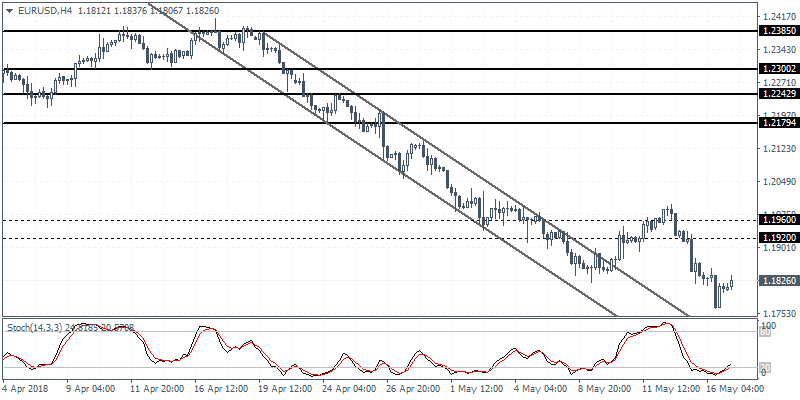
EUR/USD (1.1826):The EUR/USD continued to extend the declines with price action falling to fresh lows of 1.1763 on the day. With the resistance level at 1.1960 - 1.1920 holding, we expect to see prices touching down to 1.1730 level of support in the near term. Alternately, the currency pair could maintain the sideways range within the said levels. There is also a potential falling wedge pattern that could be forming near the current levels however, we expect to see another short term local high being formed near the price level of 1.1920. The bias shifts only on a strong close above the resistance level.
GBP/USD intra-dayanalysis

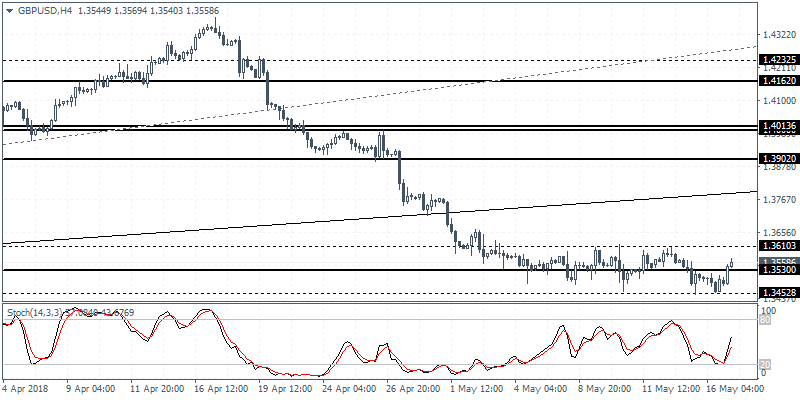
GBP/USD (1.3558):The GBP/USD was seen attempting to recover from the previous declines below 1.3530 level. Although price action is seen retesting this level we expect to see further consolidation taking place near. The sideways price action has formed a short term range of 1.3610 - 1.3453 level. A breakout from this range will suggest the near term direction in prices. The bias is to the upside for a retest of 1.3900 level in the near term. To the downside, with prices briefly falling below the 1.3500 level, the support level in this region is likely to hold.
XAU/USD intra-day analysis

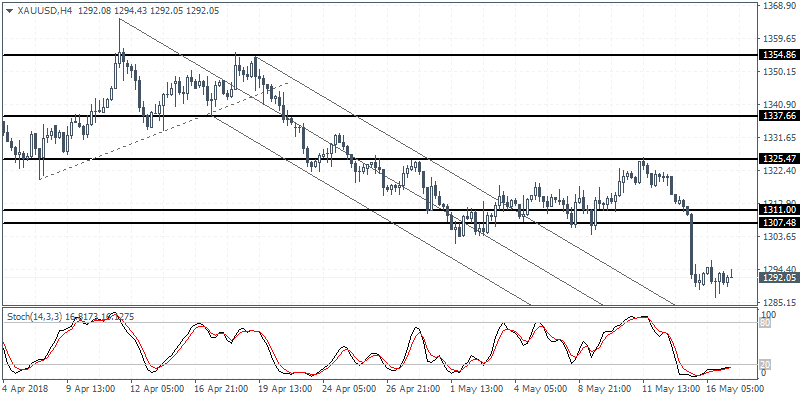
XAU/USD (1292.05):Gold prices have turned flat in the near term following the strong declines previously. With prices trading near the 1292 - 1300 region we expect to see a near term consolidation. The daily price action has resulted in a doji candlestick pattern being formed near the current lows. There is a possibility for gold prices to briefly retrace the losses. However, any gains are likely to be limited to the 1311 - 1307 level of resistance in the near term. A break down from the current lows at 1292 could signal a move toward the 1250 region of support.
