For bears, AUD/USD is the gift that keeps giving!
“The Cleanest Trend in the FX Market,” as we’ve been calling the pair in our trade recommendations for months now, hit a 20-month low earlier this week. Imagine: a trader who went short the pair at its peak above 0.8100 in late January and then went to sleep for the last eight-and-a-half months would be up over 1,000 pips.
Of course, it’s impossible to predict such moves in advance, but the trend’s consistency provides a compelling case for utilizing a trend-following strategy. Whether you captured every pip of the drop or have merely caught some of the swings, the key question is whether this trend can extend further from here.
From a fundamental perspective, the persistent trend has been driven by several powerful catalysts:
- Industrial metals, Australia’s most important export category, have come under heavy selling pressure.The S&P GSCI Industrial Metals Index has fallen by 15% from April’s peak above $1500.
- The latest headlines suggest that a US-China trade war could only escalate from here. In fact, JP Morgan analysts recently noted that a “full blown trade war” between China and the US is the bank’s base-case scenario for 2019.
- Meanwhile, tensions between Australia and China (its biggest trade partner) continue to rise, with China denying visas to Australian journalists and Australia banning China’s Huawei from its mobile network market.
- Westpac (NYSE:WBK), one of the “Big Four” banks, raised mortgage rates, putting further pressure on Australian consumers.
- The country is going through political turmoil, with former Prime Minister Malcolm Turnbull resigning (more like Turn-Bear on the Aussie!) and replaced by Scott Morrison.
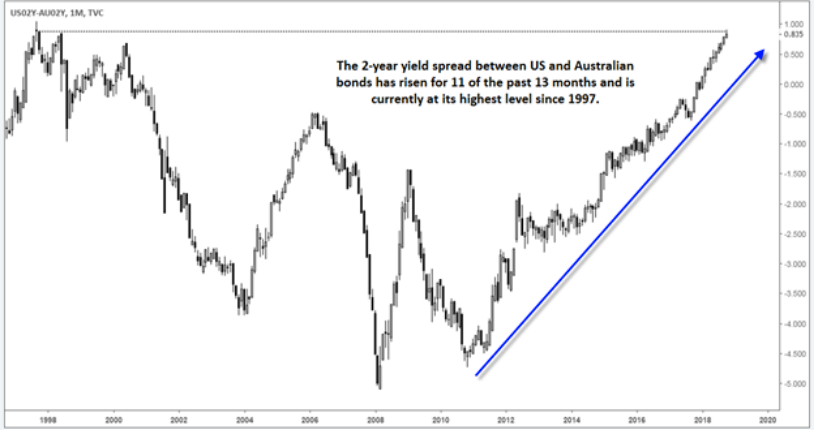
- The yield spread between US and Australian 2-year bonds has risen for 11 of the past 13 months to hit its highest level since 1997!

Source: TradingView, Faraday Research
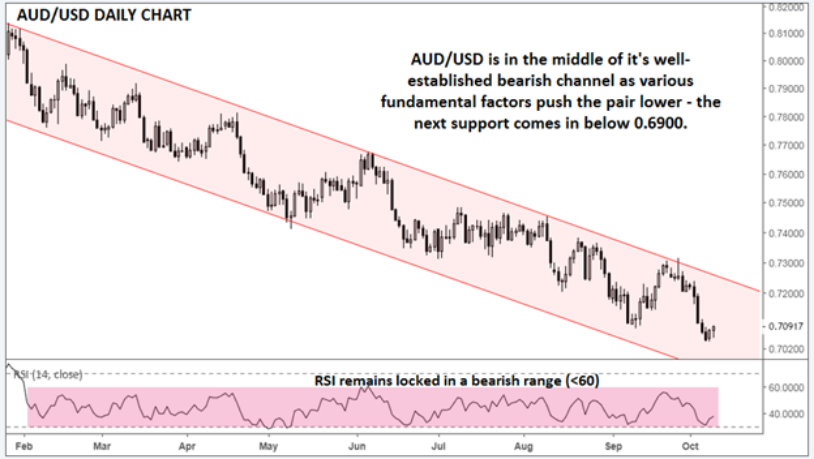
With most of these drivers showing no signs of abating, AUD/USD may drift lower within its well-established bearish channel. The longer-term chart (not shown) shows little in the way of previous support until below 0.6900 and the RSI indicator remains locked in a bearish range (<60), suggesting that the downtrend remains healthy.
Bears will be watching for the RSI to break above 60 or for rates to close above the bearish channel to change their tune on the pair. But until we see one of those developments, AUD/USD’s path of least resistance remains to the downside.

Source: TradingView, Faraday Research
Cheers
