Get 40% Off
🚨 Volatile Markets? Find Hidden Gems for Serious OutperformanceFind Stocks Now

AUD/USD And EUR/JPY Analysis: March 16, 2018

Published 03/16/2018, 06:14 AM
Updated 03/21/2024, 07:45 AM

AUD/USD

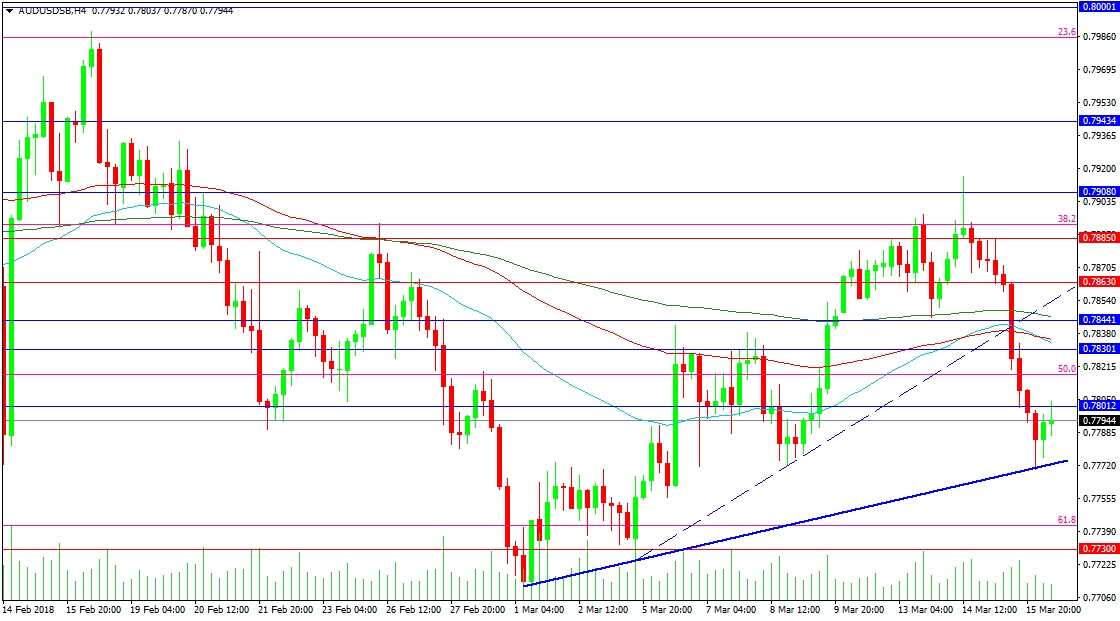
The AUD/USD pair failed to stay above the 0.79000 level and broke down under trend line support late yesterday, to test the next supporting trend line at 0.77707. A fall below this area would see a sustained push lower to the 0.77300 level and the February lows at 0.77122. A loss under 0.77000 would target 0.76950 initially, with further support at 0.76400 and 0.76100.

Resistance has been tested today just above 0.78000, with 0.78300 and the 50 and 100-period moving averages at 0.78332. The 0.78441 level is just above, with the 200-period MA above it at 0.78465. The broken trend line is located at 0.78525 and a retest on this line might be enough to set up a later move higher to test Wednesday’s high. A break above that level targets the February high at 0.79881.

AUD/USD 4-Hour Chart

EUR/JPY

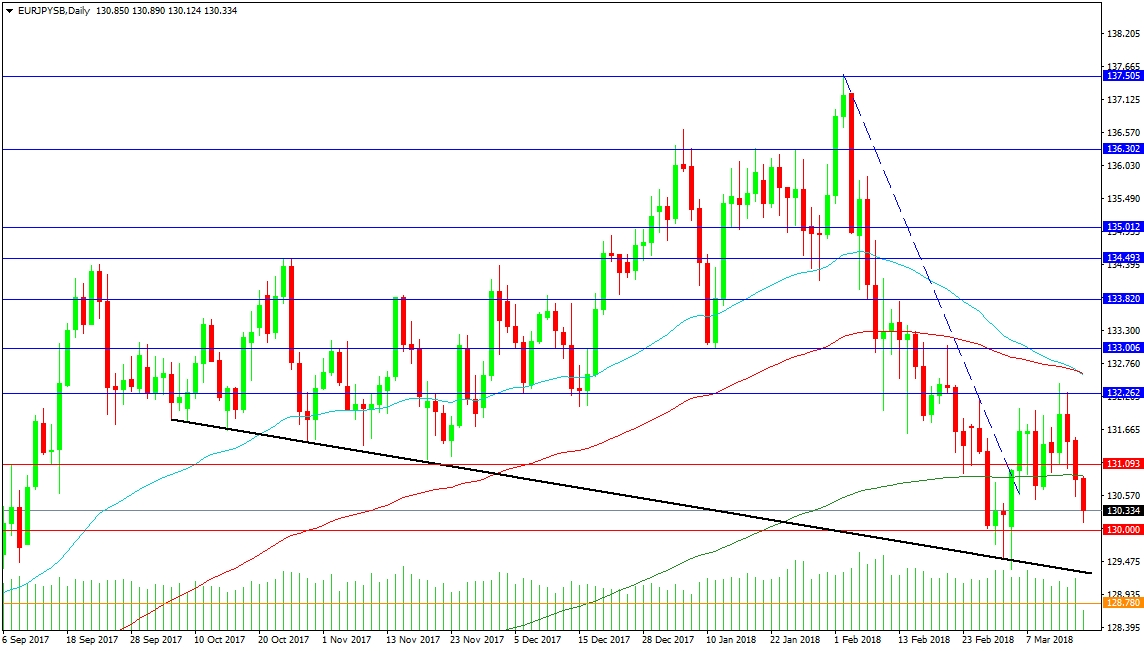
This EUR/JPY pair has tested support at the black trend line at 129.500 before rebounding higher to resistance at 132.262. Price has since moved lower again towards 130.000. The 200 DMA at 130.906 has provided resistance and a high for today’s candle. This is the median of the current trading range, as price has moved back and forth across it since first contact on February 23rd. Support comes at 130.000, with the black trend line at 129.292 today. Support below can be found at 128.780.

Resistance above the 200 DMA is located at 131.093 and 132.262, with the 50 and 100 DMAs at 132.593. The 133.000 level needs to be taken if the market wants to move on to its February highs. A break above this level completes the first step but there are key levels of resistance at 133.820 and 134.493. The 135.000 level forms the bottom of an area of consolidation used in January up as far as 136.302, with a break above leading to the high at 137.498.

3rd party Ad. Not an offer or recommendation by Investing.com. See disclosure here or remove ads .

EUR/JPY Daily Chart

Latest comments

Risk Disclosure: Trading in financial instruments and/or cryptocurrencies involves high risks including the risk of losing some, or all, of your investment amount, and may not be suitable for all investors. Prices of cryptocurrencies are extremely volatile and may be affected by external factors such as financial, regulatory or political events. Trading on margin increases the financial risks.
Before deciding to trade in financial instrument or cryptocurrencies you should be fully informed of the risks and costs associated with trading the financial markets, carefully consider your investment objectives, level of experience, and risk appetite, and seek professional advice where needed.
Fusion Media would like to remind you that the data contained in this website is not necessarily real-time nor accurate. The data and prices on the website are not necessarily provided by any market or exchange, but may be provided by market makers, and so prices may not be accurate and may differ from the actual price at any given market, meaning prices are indicative and not appropriate for trading purposes. Fusion Media and any provider of the data contained in this website will not accept liability for any loss or damage as a result of your trading, or your reliance on the information contained within this website.
It is prohibited to use, store, reproduce, display, modify, transmit or distribute the data contained in this website without the explicit prior written permission of Fusion Media and/or the data provider. All intellectual property rights are reserved by the providers and/or the exchange providing the data contained in this website.
Fusion Media may be compensated by the advertisers that appear on the website, based on your interaction with the advertisements or advertisers.
© 2007-2024 - Fusion Media Limited. All Rights Reserved.