
EU and US indices traded in the green yesterday as investors maintained their optimism over a potential global economic recovery. However, most Asian bourses slid due to reports suggesting that the Trump administration is considering a range of sanctions against China, and after media reported that the world’s second largest economy expanded the scope of the draft national security legislation on Hong Kong.
EU AND US EQUITIES GAIN, ASIAN INDICES SLIDE
The dollar traded lower against all the other G10 currencies on Tuesday and during the Asian morning Wednesday. It underperformed the most versus NOK, CAD, AUD, and NZD in that order, while it lost the least ground against SEK, JPY, EUR and CHF.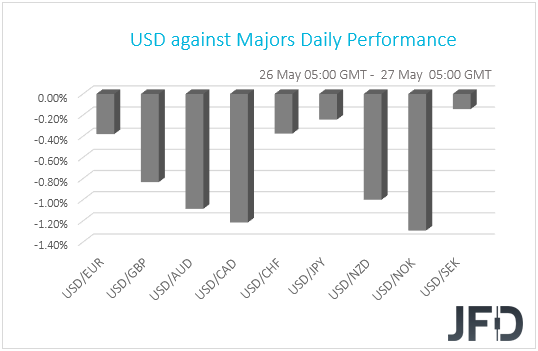
The commodity-linked currencies continued to attract flows, while the safe havens stayed on the back foot, suggesting that investors maintained their optimism over a potential global economic recovery due to the loosening of the coronavirus-related restrictions. EU indices closed in the green, while resuming trading after Monday’s bank holiday, UK’s FTSE 100 gained 1.24% as PM Johnson said on Monday that high street shops, department stores and shopping centers will reopen next month. The positive morale rolled over into the US session, with Wall Street indices surging at the open. However, they came off their highs following a report saying that the Trump administration is considering a range of sanctions on Chinese officials, businesses, and financial institutions, in response to China’s plans of imposing national security laws on Hong Kong. The subdued appetite continued during the Asian trading today as well, as media reported that China expanded the scope of the draft national security legislation to include organizations and individuals, with protests in Hong Kong flaring again. Although Japan’s Nikkei gained 0.79%, at the time of writing, China’s Shanghai Composite and Hong Kong’s Hang Seng are 0.28% and 1.15% down respectively.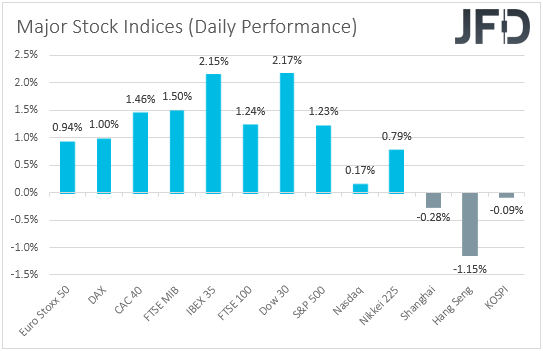
As for our view, it has not changed yet. Yes, tensions between the world’s two largest economies could jeopardize any potential trade accord, but at the moment, investors appear to be placing more bets on a global economic recovery as governments around the globe continue to ease their lockdown measures. Adding to that optimism is news that more companies are joining the race to test their coronavirus drugs on humans. For now, headlines surrounding the US-China saga are just resulting in corrections in the broader recovery. The exception to that appears to be Hong Kong’s Hang Seng. Having all that in mind, we expect equities and risk-linked currencies, like the Aussie, to rebound again, and safe havens, like the dollar, the yen, and the franc, to stay on the back foot. In order to start worrying over larger declines in the equity world, we prefer to wait for actions rather than just talks, namely, the actual imposition of sanctions, or one of the US and China withdrawing from the process of achieving a trade accord.
S&P 500 – TECHNICAL OUTLOOK
The S&P 500 continues to move higher, while balancing slightly above a short-term tentative upside support line taken from the low of May 14th. Yesterday, the index found resistance near the 3024 barrier and then corrected a bit lower. That said, the price still remained above the psychological 3000 mark. For now, we will remain somewhat positive, but to get a bit more comfortable with higher areas, we would prefer to see a break above yesterday’s high first.
A push through the 3024 zone would confirm a forthcoming a higher high, which may attract more buyers into the game. The S&P 500 could then travel to the 3084 obstacle, marked near an intraday swing high of March 5th. The price might get held there for a while, or it may be forced to correct a bit lower. However, if the index continues to float above the aforementioned upside line, the bulls could take charge and drive it up again. If the 3084 hurdle breaks this time, the next potential target might be at 3131, which is the high of March 4th.
On the downside, if the previously-discussed upside line breaks and the price falls below the 2980 area, marked by the highs of May 19th and 20th, that might change the direction of the short-term trend and open the door to some further declines. The index may then drift to the 2957 zone, a break of which could allow the sellers to push it towards the low of May 22nd, at 2909.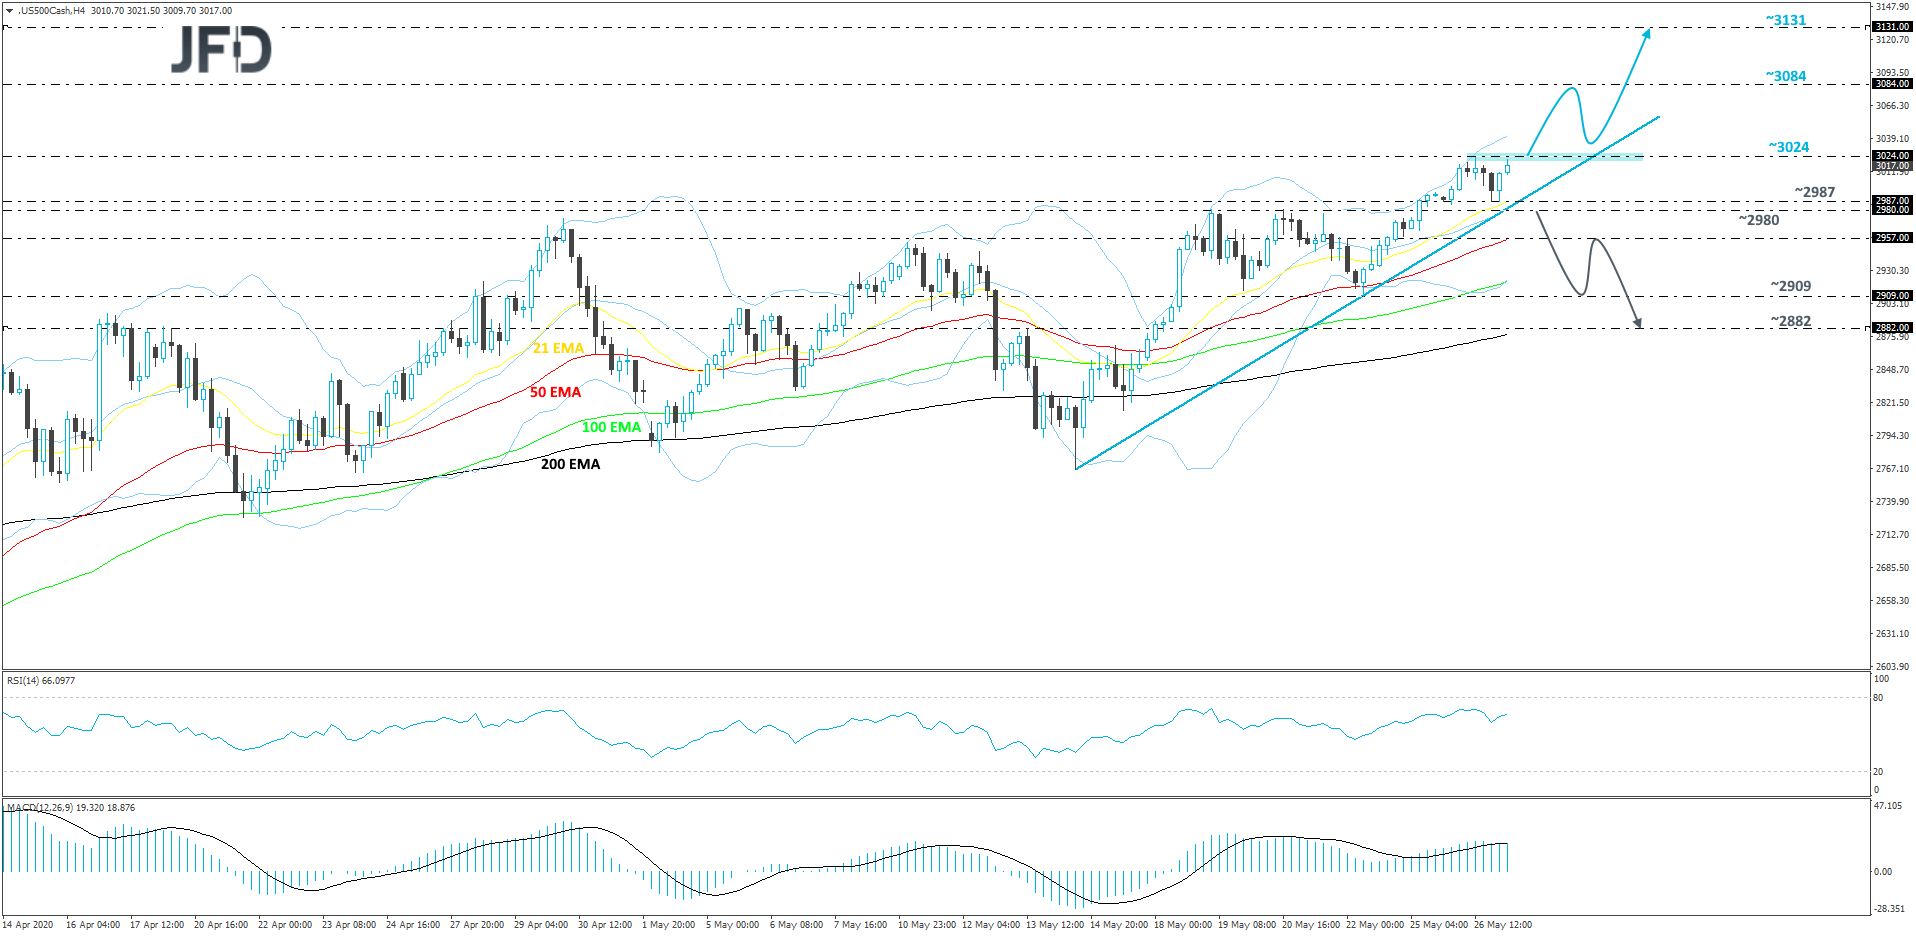
AUD/USD – TECHNICAL OUTLOOK
Yesterday, AUD/USD rushed to the upside, overcoming last week’s high, at 0.6616, but getting halted near the 0.6675 barrier. From there, the pair started correcting lower and is now moving back to that 0.6616 hurdle again. The rate still has a chance to move up again, as long as it continues to balance, either above the 0.6616 zone, or a short-term tentative upside support line taken from the low of May 15th.
As mentioned above, AUD/USD could move a bit more to the downside, however if it gets a hold-up near the 0.6616 zone, which is the high of last week, or near the aforementioned upside line, that may help lift the rate up again. If so, the pair might test the current highest point of this week, at 0.6675, a break of which would confirm a forthcoming higher high and could open the door for a further acceleration. The next possible resistance area to consider may be near the 0.6750 level, marked by the high of February 12th.
Alternatively, if the rate suddenly breaks the above-mentioned upside line and falls below the 0.6550 hurdle, which is the high of May 25th, that may temporarily spook the bulls from the field and allow more bears to join in. AUD/USD could then travel to the 0.6505 obstacle, a break of which might clear the path to the 0.6473 level, marked by the inside swing high of May 15th.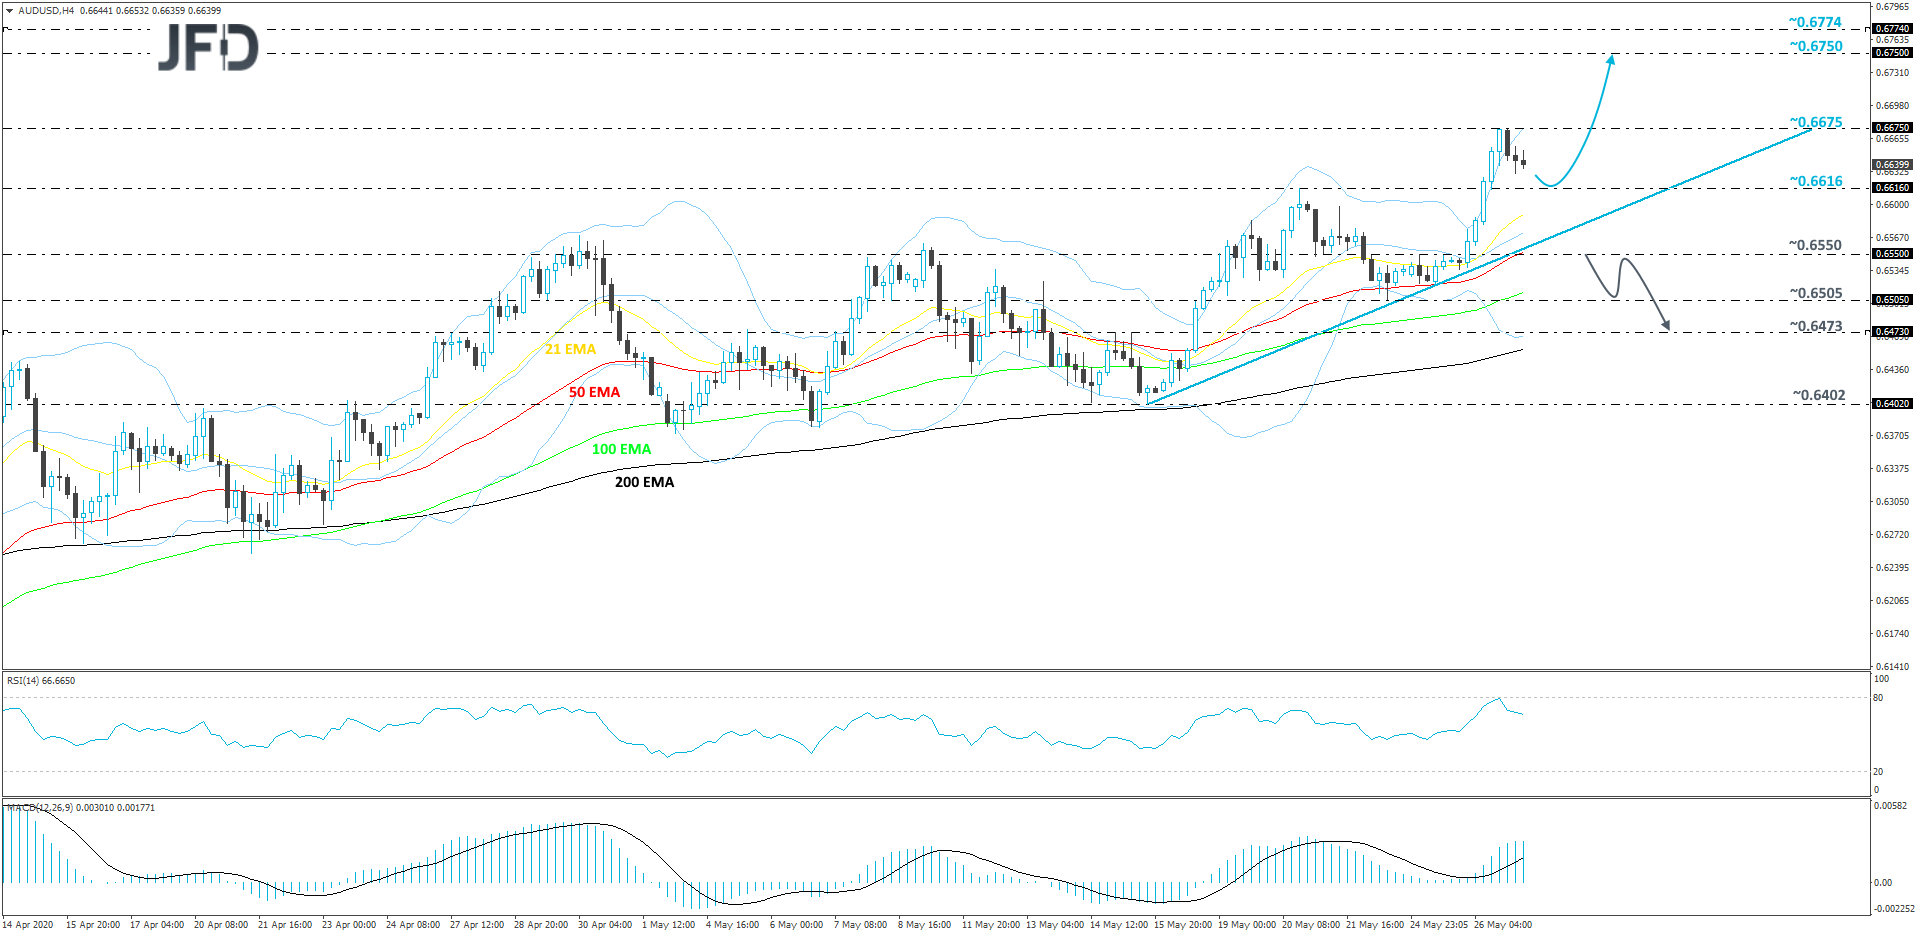
AS FOR TODAY’S EVENTS
There are no major economic indicators on today’s schedule. The only data worth mentioning is the API (American Petroleum Institute) weekly report on crude oil inventories, but as it is always the case, no forecast is available.
Investors may be eager to find out details on the European Commission’s plan over a financial rescue fund for the bloc, after Austria, Sweden, Denmark, and Netherlands opposed the plan proposed by France and Germany.
As for the speakers, we have three on the agenda. ECB President Christine Lagarde and ECB Vice President Luis de Guindos will speak during the European morning, while later, in the US session, we will get to hear from St. Louis Fed President James Bullard. We will pay more attention to Lagarde’s and de Guindos’s speech as we may get more clues on whether the ECB is planning (or not) to expand its stimulus efforts at the upcoming gathering, scheduled for next week.