Asia stock indices are looking a little shaky today as the fallout from Friday’s healthcare debacle in the U.S. reverberates across the region.
In all honesty, it could have been worse after President Trump threw in the towel on health care reform and decided to move on. Perhaps the legacy of the nature of Mr.Trump’s win last year is coming back to haunt him. Having upstaged the establishment choices and crashed the party, he did not ever have the chance to build a meaningful power base of alliances across the Houses of Congress, despite both of them also swinging to Republican majorities.
That said he might have played a sublime blinder against the aforementioned parts of his very fractured party. By effectively sending them all to the naughty corners for not being able to share the toys, and moving on to tax reform instead of health, he is effectively putting the onus on the Senate and House of Representatives to get their act together. In pushing forward to the next items on his agenda, he is effectively saying it all won’t fail because of me and nor will I be blamed. Perversely, therefore, he may actually find Congress much more cooperative going forward.
This realisation may be why the fallout has not continued with as much impetus in Asia today as it did Friday. Stocks are lower following on, and bond yields have dropped. The U.S. dollar gapped lower on the open this morning and has stayed heavy against the G.10’s and regionals, but has yet to make another serious leg lower in the short term. Asia stocks have been negative but not much so. Nevertheless, most indices are trading towards the lower end of their recent ranges, and further losses could not be ruled out.
ASX
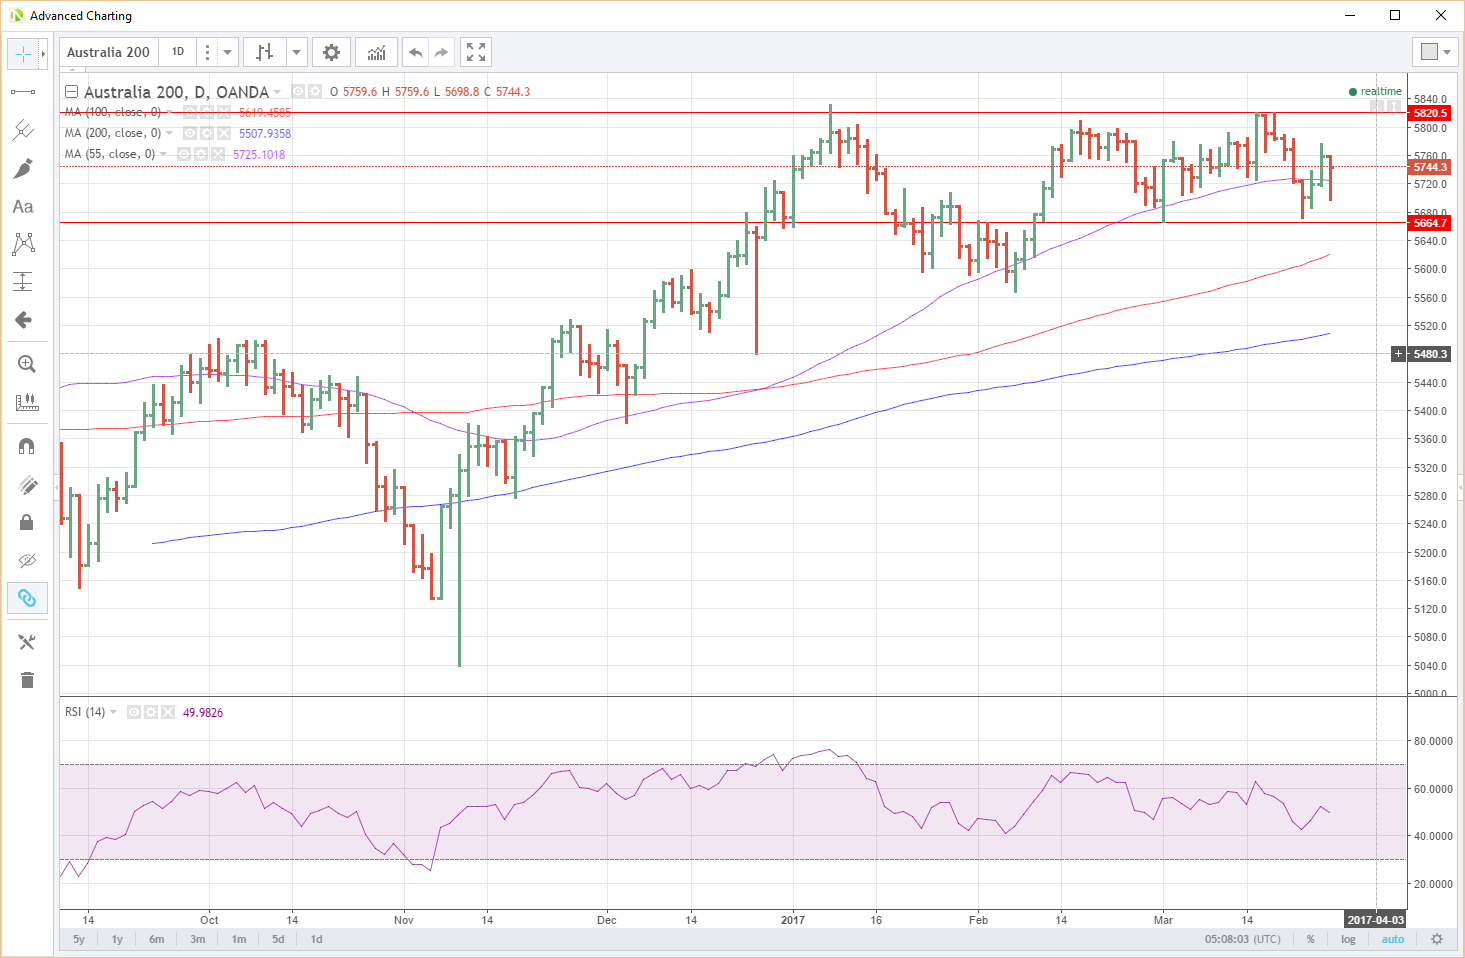
Last week’s 7% drop in iron ore plus an impending interruption by a super cyclone added to the bearish tone following on from the U.S. on Friday. The ASX has closed mid-range in Sydney but with a definite heavy tone are recovering some initial losses.
A well-defined top in the 5820 area has been tested a number of times. Most likely we will need to see new highs in the United States and a recovery in resource prices to give it new legs above for now.
Support is at 5665, a triple bottom on the daily chart, with the 100-day moving average behind this at 5620.

Japan 225
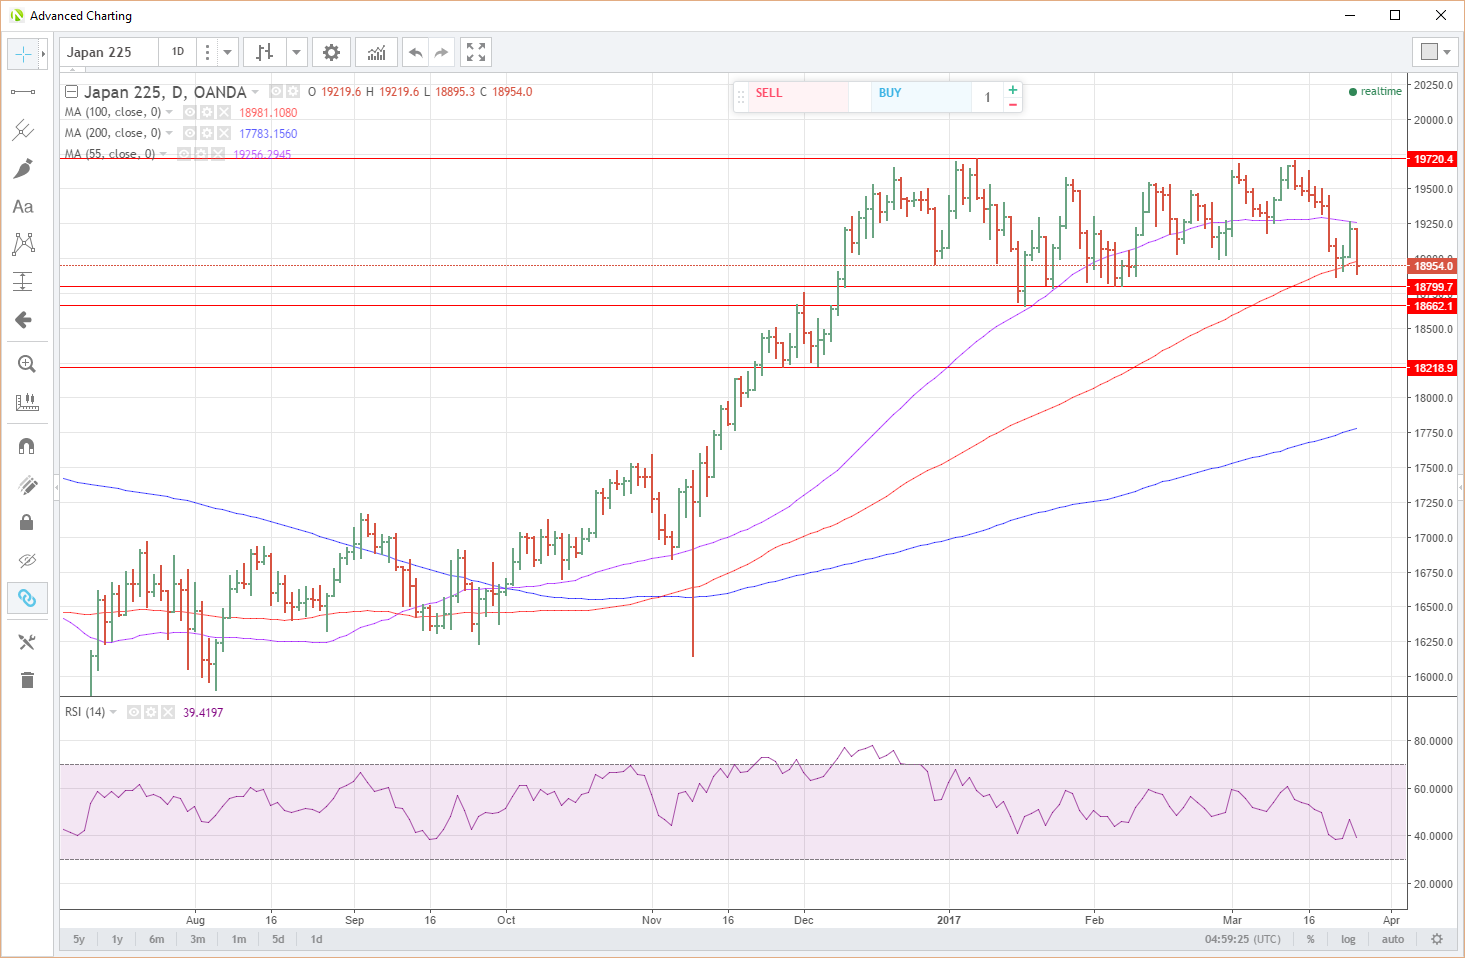
Life is looking a bit worse for the Nikkei from a technical perspective. Anchored near its daily lows, it is in danger of having a daily close below its 100-day moving average (dma) at 18980. This would be a bearish signal and could preface a test of supports at 18800 and 18662. A close below there could signal a move to 18218.
Up above initial resistance is at Thursday’s high and the 55-dma at 19257. A break here could mean a move back towards the 19720 area. This is now a massive topping formation and will be a formidable level to break.
The Nikkei’s fate probably relies on the USD/JPY finding some friends and arresting its sell-off. A stronger yen weighs heavily on Japan’s very export driven corporate sector.

Hong Kong
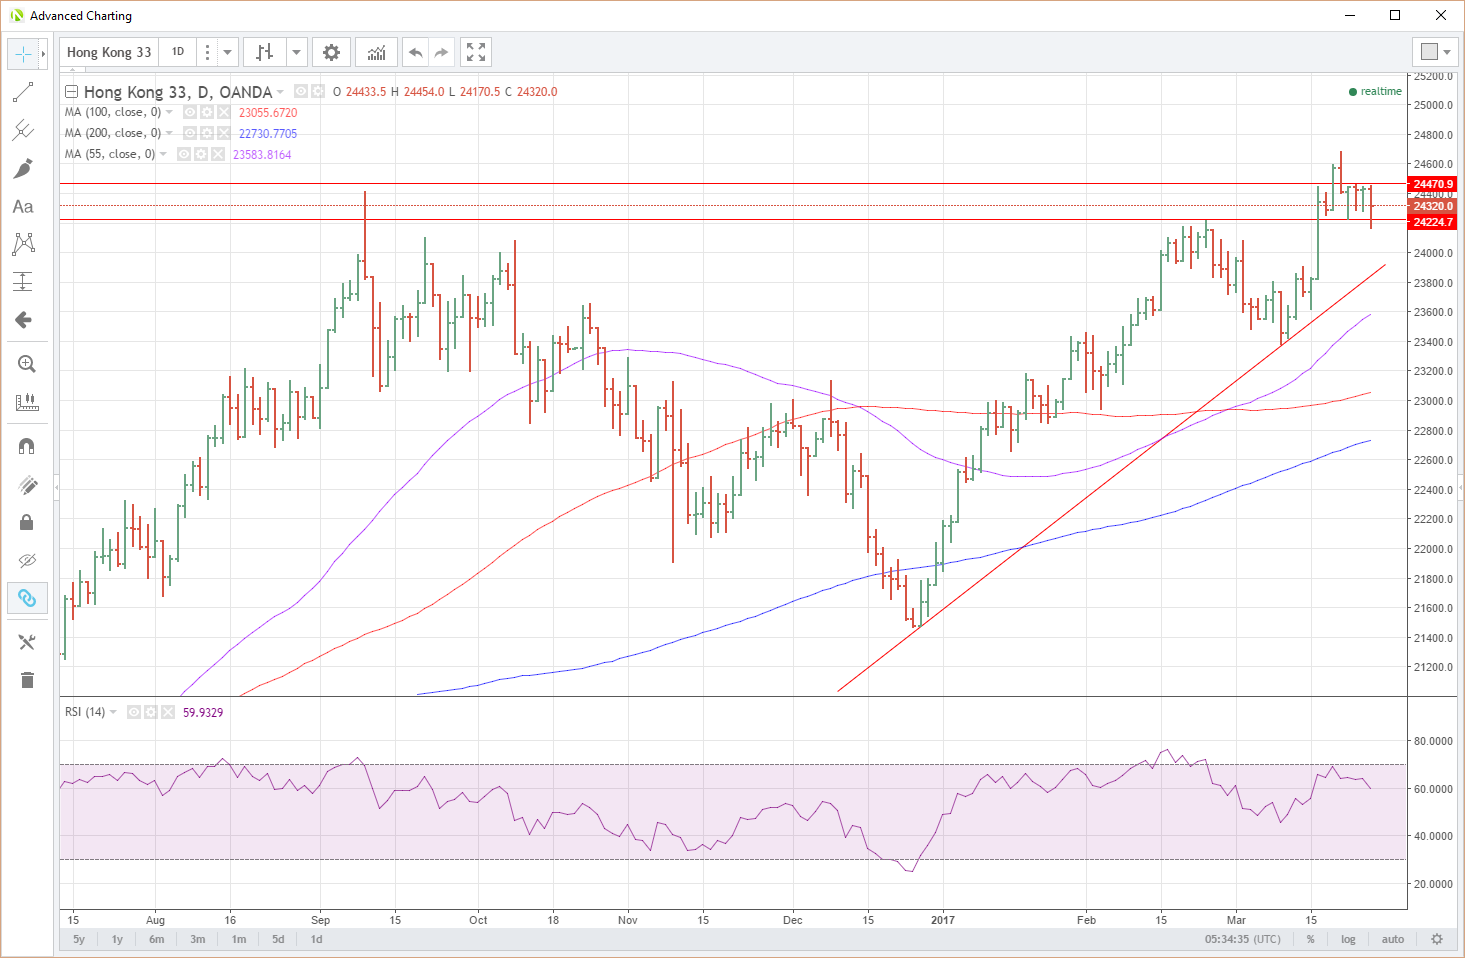
Closing towards the lower end of an admittedly very tight recent range near 24320.
Resistance is at 24470 and then the recent high at 24686.
Support is at the 24225 area with a daily close below opening up a technical move to the ascending support line at 23850.

China A50
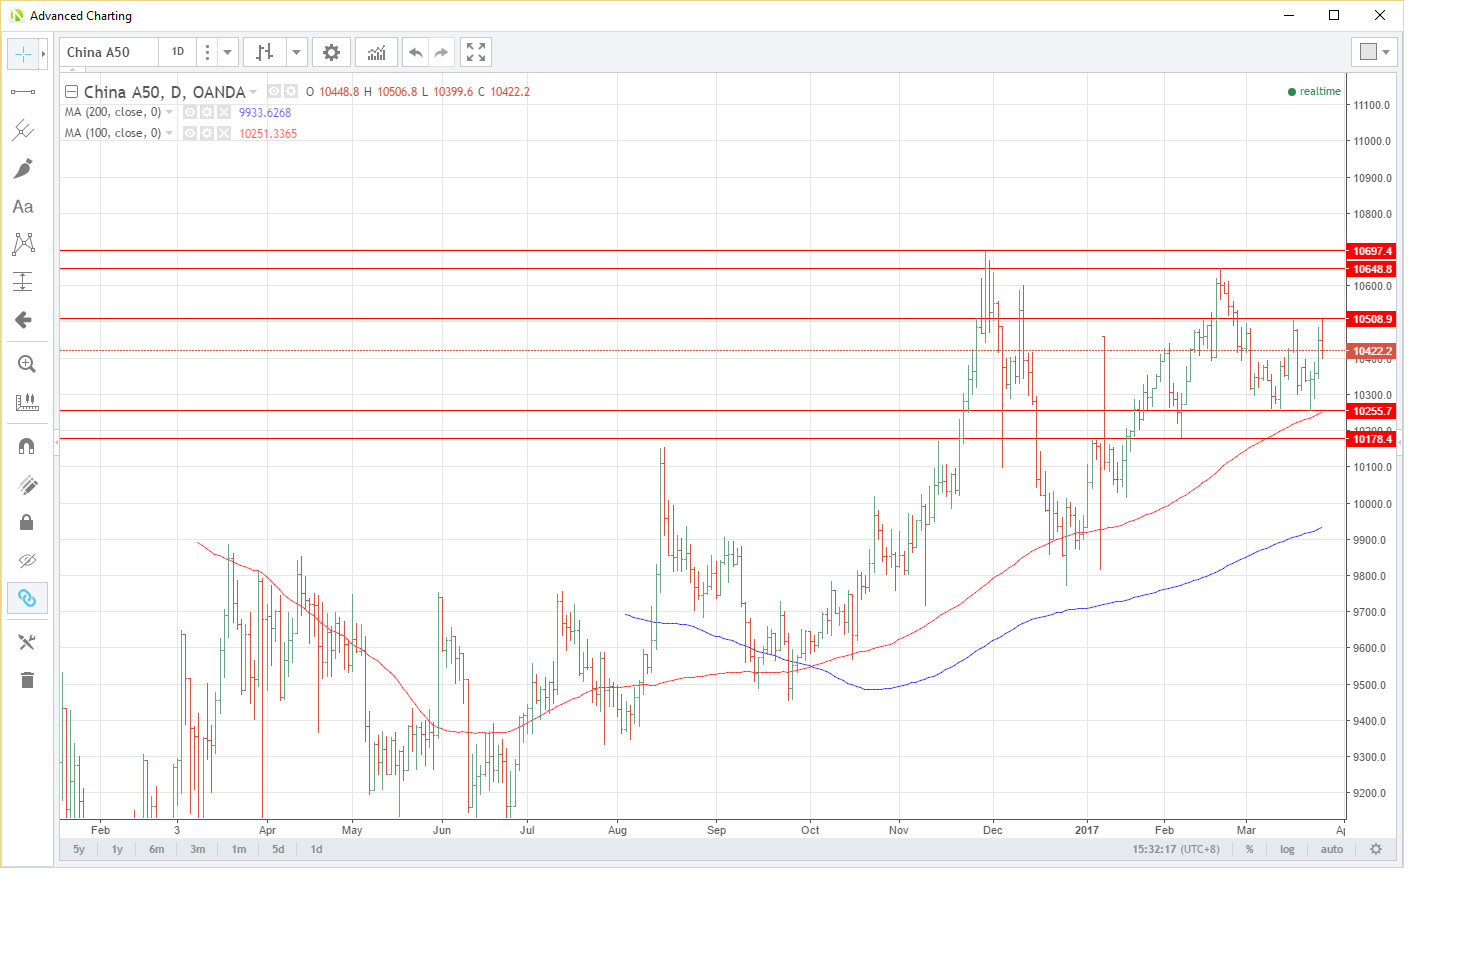
The China A50 composite index looks solidly rangebound. Today’s better than expected Chinese Industrial Profits number gave mainland traders something to cheer above and offset the disapointments of Friday in the U.S.
The China A50 has resistance at the 10508 area where it has failed three times recently. A close above opens 10648 and then 10697, the December high.
Key support sits at the 100-dma at 10251 which is also a series of daily lows. Below here the next support level is 10178.

Summary
The USD aside, the fallout in Asia of Friday’s legislative failure has been modest although some indices are nibbling at their supports. The news may not have been as bad as first thought at a closer look, with President Trump having cleverly put the onus on the Republican Congress to get it’s act together and support his legislative programme going forward. Further correction of a strong USD and eye-watering equity valuations cannot be ruled out, but in the bigger picture, President Trump may have lost a battle but could be on track to win the war.
