Bulls Keep Runnin’
Let’s start with a quick update from last week.
“Since the beginning of January, the markets have remained in a very low volatility sideways trading pattern as shown in the chart below. However, this past week all three indices broke out to the upside with the Dow moving above 20,000 and the S&P 500 surging above the 2,300 mark.”
“There are plenty of bullish supports currently that warrant keeping portfolios exposed to equity risk currently:
- The bullish trend remains intact as noted by the red dashed line in the first chart above.
- The NYSE Advance/Decline remains bullish biased
- The number of stocks on bullish buy signals remains bullish
- The number of stocks above their 50 and 200 DMA’s is rising.
- Bullish confidence is high
- Volatility remains low”
This past week, as President Trump reiterated that a “terrific tax cut” package was forthcoming, stocks rocketed higher earlier in the week and attempts to sell off on Thursday and Friday were quite muted.
While the “bullish backdrop” clearly remains, there is ample evidence to reduce overweight equity positions and refrain from making new purchases currently.
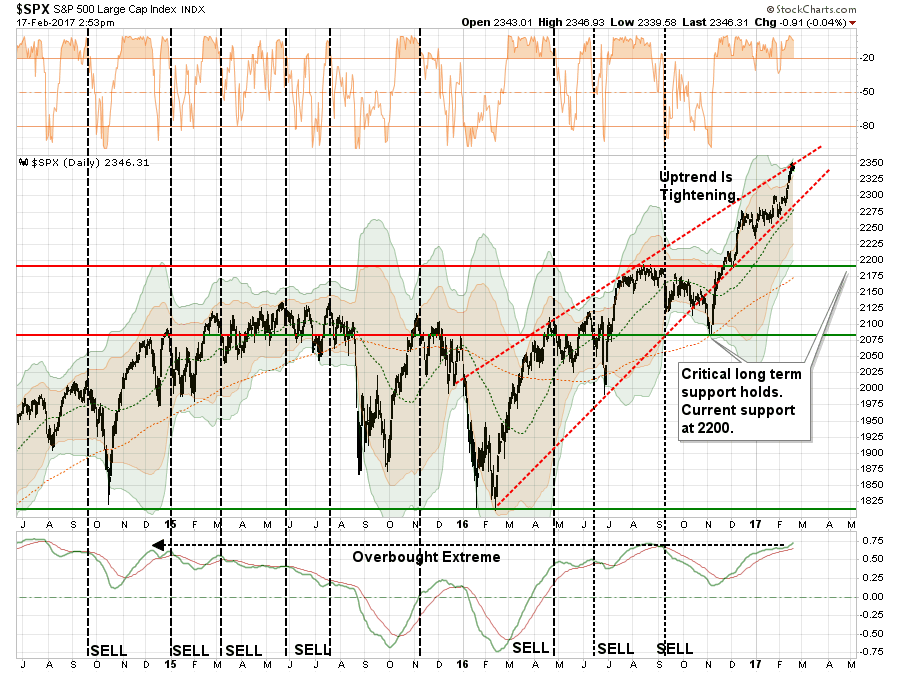
As shown in the chart below, the deviation in the price of the S&P 500 from its underlying 50 and 200 day moving averages, bottom two indicators, are currently at extreme levels. At these levels, a pullback or correction has been a common occurrence.

A correction can happen in one of two forms:
- The price of the index begins to trade in a sideways pattern for a couple of weeks which allows the underlying moving average to catch up with the price, OR;
- The price corrects to, or beyond, the underlying average.
While a sideways correction is entirely possible, it generally rarely happens. Most likely, a correction would entail a price reversion towards 2175 to 2200. Given the market finds support at these levels, investors should be afforded a better entry point to add exposure. However, a violation of those levels would suggest a deeper correction is in the making.
I am temporarily holding off adding new equity positions to portfolios currently until the risk/reward opportunity becomes a bit more favorable. However, with portfolios nearly fully allocated at this juncture my bigger concern is focused on the numerator of the risk/reward equation.
Signs Of Excess
It isn’t just price extensions of the market that is currently concerning but the underlying excesses as well.
On Tuesday, I reviewed the COT (Commitment Of Traders) data which is exceptionally important data as it is the sole source of the actual holdings of the three key commodity-trading groups, namely:
- Commercial Traders: this group consists of traders that use futures contracts for hedging purposes and whose positions exceed the reporting levels of the CFTC. These traders are usually involved with the production and/or processing of the underlying commodity.
- Non-Commercial Traders: this group consists of traders that don’t use futures contracts for hedging and whose positions exceed the CFTC reporting levels They are typically large traders such as clearinghouses, futures commission merchants, foreign brokers, etc.
- Small Traders: the positions of these traders do not exceed the CFTC reporting levels, and as the name implies, these are usually small traders.
The data we are interested in is the second group of Non-Commercial Traders. This is the group that speculates on where they believe the market is headed. While you would expect these individuals to be “smarter” than retail investors, we find they are just as subject to human fallacy and “herd mentality” as everyone else.
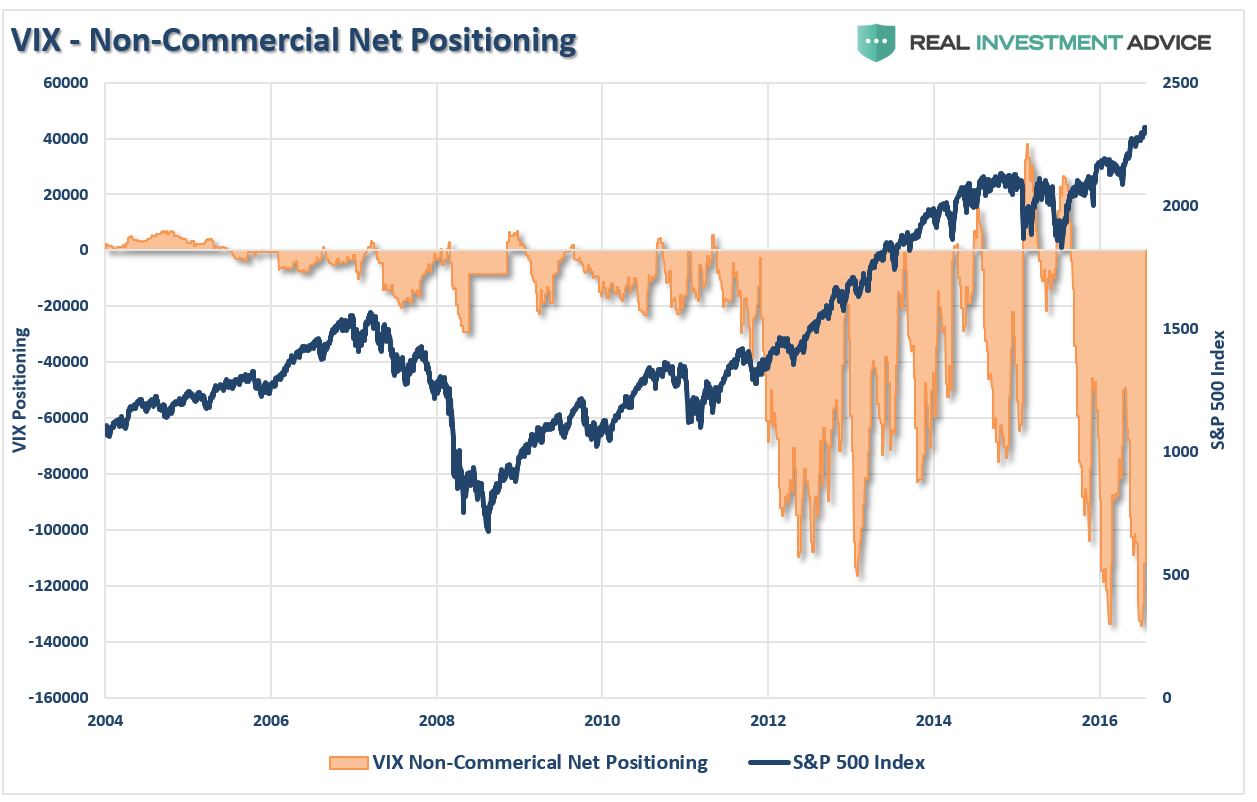
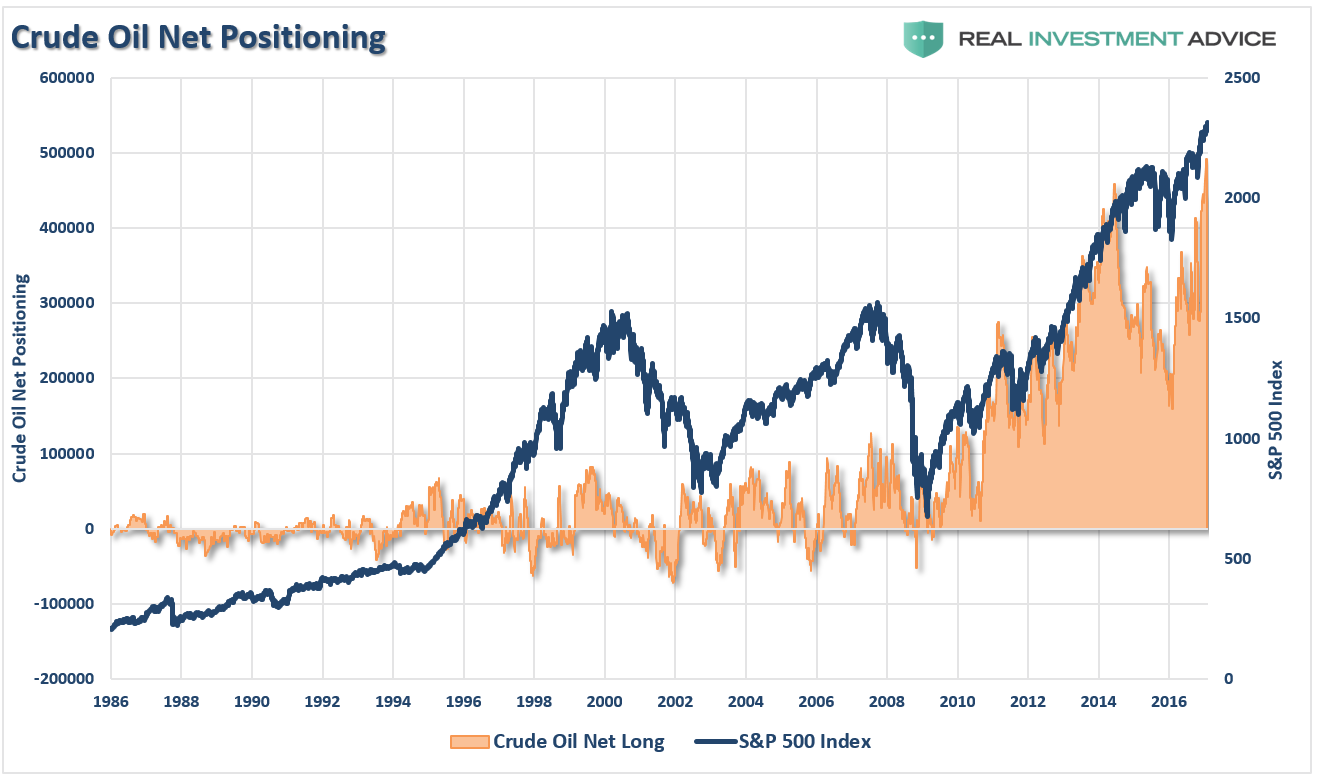
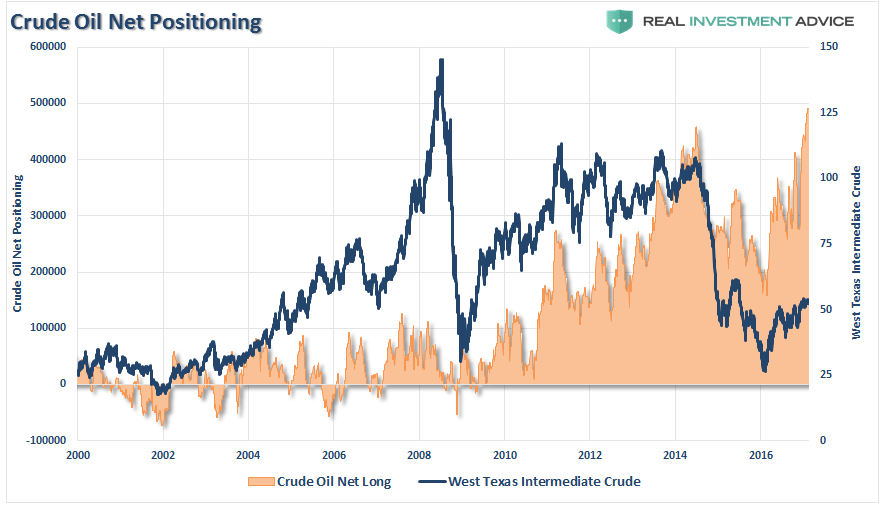
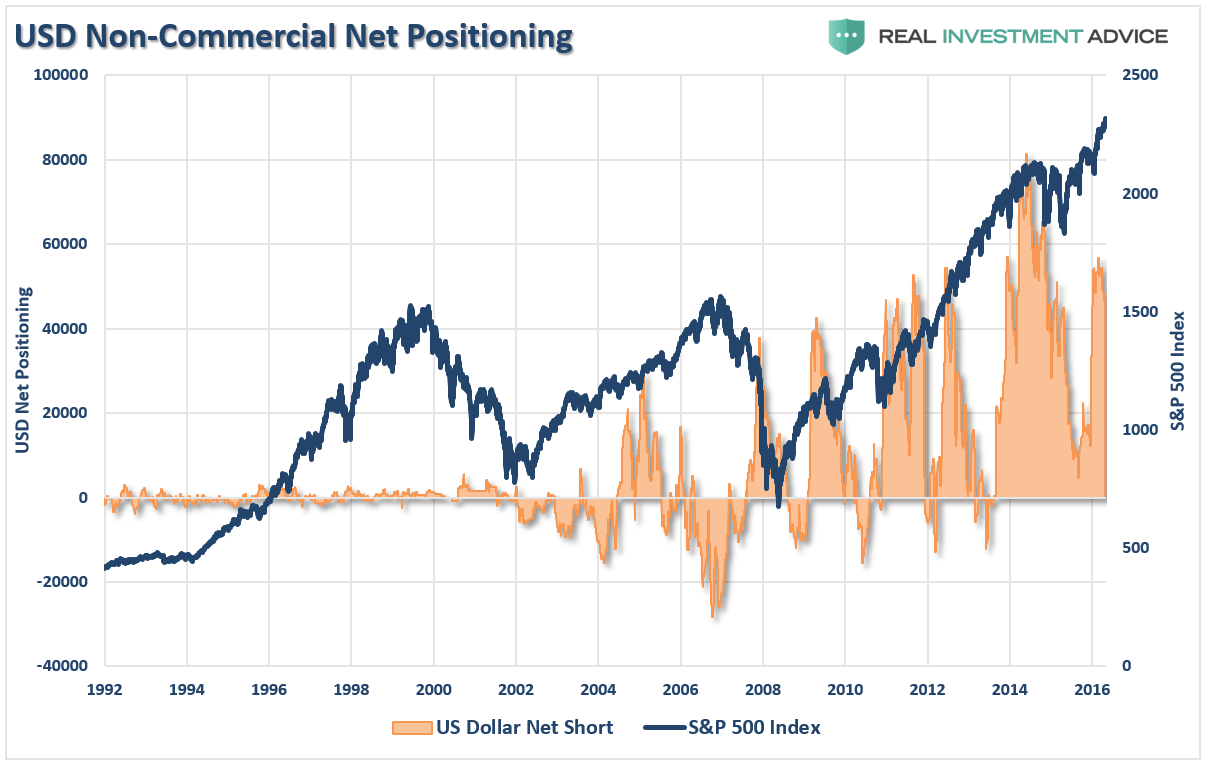
Therefore, as shown in the series of charts below, we can take a look at their current net positioning (long contracts minus short contracts) to gauge excessive bullishness or bearishness. With the exception of the 10-Year Treasury which I have compared to interest rates, the others have been compared to the S&P 500.
The extreme net-short positioning on the volatility index suggests there will be a rapid unwinding of positions given the right catalyst. As you will note, reversals of net-short VIX positioning has previously resulted in short to intermediate term declines.
Crude oil positioning is also highly correlated to overall movements of the S&P 500 index. With crude traders currently more “long” than at any other point in history, a reversal will likely coincide with both a reversal in the S&P 500 and oil prices being pushed back towards $40/bbl.
While oil prices could certainly fall below $40/bbl for a variety of reasons, the recent bottoming of oil prices will likely favor some support around that level. Given the extreme long positioning on oil, a reversion of that trade will likely coincide with a “risk off” move in the broader markets as well. If you are overweighted energy currently, the data suggests a rebalancing of the risk is likely advisable.
The same goes for the US dollar. While net positioning is not at historic extremes, it is at levels which would coincide with a short to intermediate-term correction in the S&P 500.
Of course, as I have previously discussed, there are also signs of excess in:
- Leverage – both in margin and corporate debt.
- Bullish Sentiment
- Valuations
- The “High-Yield” Chase
- Market Capitalization Ratios
Currently, there is an implicit disregard for fundamentals. Of course, such disregard has historically been a hallmark of poor future returns for investors.
Seen This Before
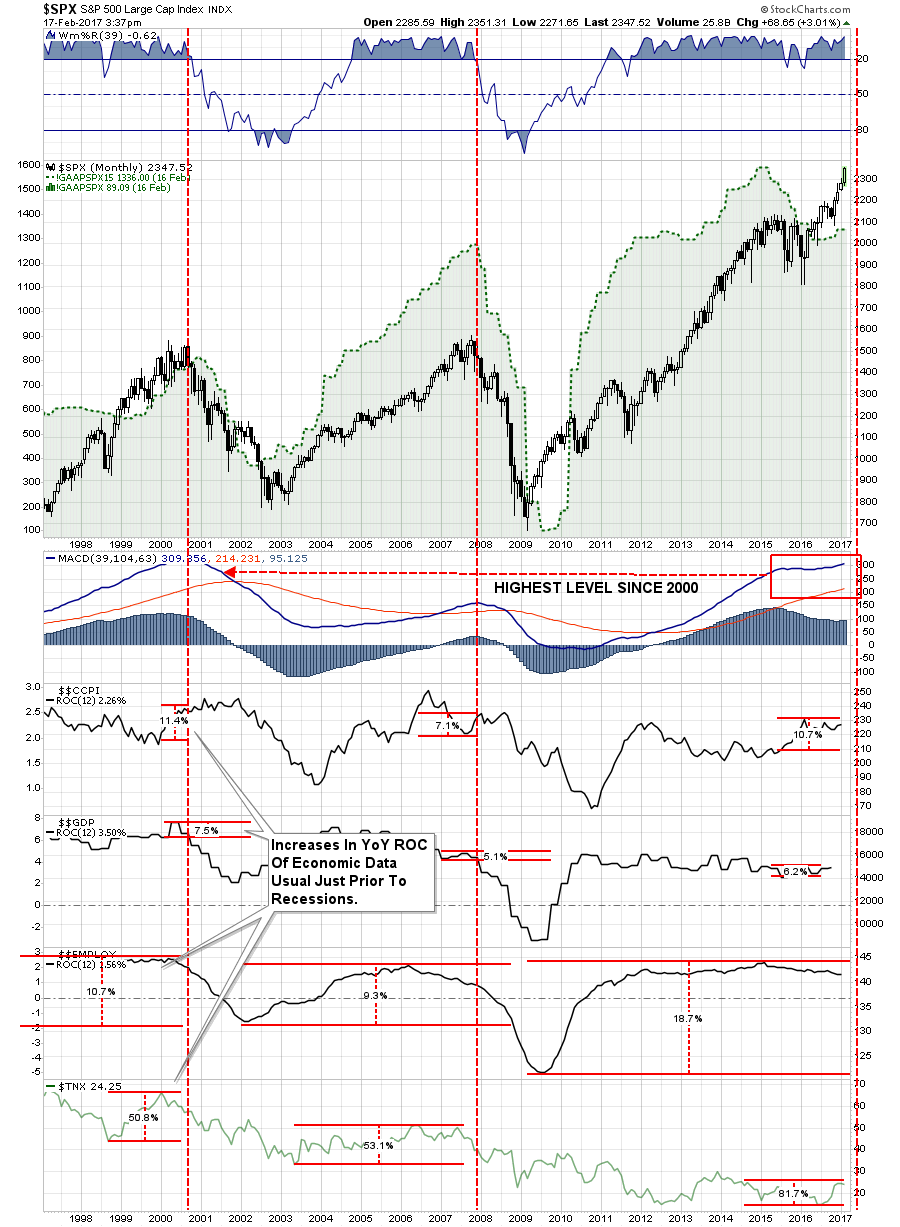
In both previous bull market peaks we find, as measured as a percentage change from the previous bottom to the current level, the following:
- CORE INFLATION rose 11.7% and 7.1% just prior to the recession. Currently, Core CPI is up 11.1%
- GDP GROWTH picked up by 7.5% and 5.1% just prior to the recession. Currently, GDP is up 6.8%
- EMPLOYMENT was up from lows by 9.1% and 8.6%. Currently, Employment is up 19.0%
- INTEREST RATES rose 50.8% and 51% from lows. Currently, Rates are up 87.9%
As we saw just prior to the beginning of the previous two recessions, such a bump is not uncommon as the impact of rising inflation and interest rates trip of the economy. Given the extreme speculative positioning in oil longs, short bonds, and short VIX, as discussed recently, it won’t take much to send market participants scrambling for the exits.
While I am NOT suggesting that we are about to have the next great market crash tomorrow, the current sensation of “Deja Vu” might just be worth paying attention to.
The most interesting setup currently for investors, is the massive net-short position on US Treasury Bonds. Given the aggressive leveraging in the markets above, a reversal in the S&P 500 will likely send money rushing into bonds for “safety.” That rush will fuel a short-covering spree in bonds forcing yields towards 1.5% or lower.

This is an area that I am looking at adding more of into portfolios to hedge the long-equity bias currently.
Babson’s 10-Commandments of Trading
My colleague, Mark Yusko, just recently penned his 4th-quarter market review which is well worth reading in its entirety. However, buried inside of it was this terrific bit of insight from Roger Babson.
“Roger Babson’s success as an investor, and in running his investment research firm was, to some large degree, based on his unique (some might say unorthodox) beliefs in how markets functioned. Babson was quoted as saying, “Don’t look for society to give you permission to be yourself,” and his willingness to start an investment business based on a theory that many dismissed as something akin to astrology was notable (particularly because it ended up working).
During his time at M.I.T., Babson became interested in Newton’s third law and posited a theory that the business cycle was driven in part by the interplay between human participants and gravity. Over the course of his career Babson researched and developed Newton’s theory and came to the conclusion that economic variables (and even the stock market itself) could be explained by the gravitational forces of the earth. Working with M.I.T. Professor of Engineering George F. Swain, Babson applied the concept of actions and reactions to classical economics, which led to the development of the Babsonchart of Economic Indicators. The Babsonchart was designed to not only assess current economic, business and investment conditions, but to predict future conditions as well. Having amassed a meaningful fortune himself, Babson expanded his business information business into wealth management after the Financial Panic of 1907 and utilized the Babsonchart to counsel on when it was wise to be in the markets or out of the markets (one of the first tactical allocation services). Babson had concluded that there was a better way to manage wealth, saying,
“More people should learn to tell their dollars where to go instead of asking them where they went.”
Babson thought it was important to just begin his wealth management effort with his own capital because he believed that, “people would rather be shown how valuable you are, not told.” Actions always speak louder than words, and Roger Babson was always a man of action. As a disciple of Newton, Babson drew strength from the construct of “actions and reactions,” so whenever an endeavor in Babson’s life ended, a new one immediately began to take its place. Babson had an amazing ability to never be discouraged by setbacks. One of his mantras was, “When we are flat on our backs there is no way to look but up.” Perhaps his greatest strength, however, was his willingness to take chances and to rebound when the risks at the time perceived by others seemed to overwhelm the likelihood of a successful outcome.”
Babson developed his own list of “Ten Commandments of Investing” that he encouraged his readers and clients to follow:
- Keep speculation and investments separate. This is a very important concept that is often lost on market participants. We describe it as the Three Bucket Rule. Everyone should have three buckets in their portfolio:
- The Liquidity Bucket (10% to 15% to cover lifestyle costs),
- The Stay Rich Bucket (70% to 80% that is diversified, long-term investments,) and;
- The Get Rich Bucket (10% to 15% for speculation, we joke this is for the stock tips and friends & family deals, unfortunately, you will likely lose it all, so keep it small).
- Don’t be fooled by a name. Make sure you know what you are buying as names can be deceiving. For example, the Blue Chip Growth Fund in my 401(k) that turned out to be “the Blue Chips of the future” and was actually small-cap growth instead of large-cap core.
- Be wary of new promotions. If a financial services firm is selling you something new, it is likely that they have figured out how to package up an old idea with higher fees for themselves.
- Give due consideration to market ability. Be honest with yourself about how much time you are willing to commit to investing and whether you have the knowledge, temperament and discipline to be an effective investor.
- Don’t buy without proper facts. Do your homework and never (ever) buy a stock tip. Always remember there is someone on the other side of every transaction who has done at least as much diligence and research as you have.
- Safeguard purchases through diversification. Concentrated portfolios make you rich (or poor) and diversified portfolios keep you rich. How do you create a small fortune? Start with a large fortune and stay concentrated.
- Don’t try to diversify by buying different securities of the same company. Single company risk is a very dangerous game (that said, over the past 80 years there have been some developments in capital structure arbitrage which make this rule a little less absolute).
- Small companies should be carefully scrutinized. Back in Babson’s time this was a really big deal as the small companies that went public were dicey at best, and fraudulent at worst. With the increased regulatory burden placed on public companies today, there is somewhat less risk, but small-caps are still very volatile and should be handled with extra care.
- Buy adequate security, not super abundance. Investing is about taking intelligent risks. You must take risk in order to make an adequate return, but you only want to take the risks where you are adequately compensated.
- Choose your dealer and buy outright (i.e., don’t buy on margin.) Leverage is a tool. It can be used to amplify the returns of any assets, but the danger of margin is you are leveraging leveraged assets, which can lead to problems. The real danger is leverage can’t make a bad investment good, but it can make a good investment bad through forced selling at inopportune times
“I repeat what I said at this time last year and the year before, that sooner or later a crash is coming which will take down the leading stocks and cause a decline of 60 to 80 points in the Dow Jones Barometer. Fair weather cannot always continue. The Economic Cycle is in progress today as it was in the past. The Federal Reserve System has put the banks in a strong position, but it has not changed human nature. More people are borrowing and speculating today than ever in our history. Sooner or later a crash is coming and it may be terrific. Wise are those investors who now get out of debt and reef their sails. This does not mean selling all you have, but it does mean paying up your loans and avoiding margin speculation. Sooner or later the stock market boom will collapse like the Florida boom. Some day the time is coming when the market will begin to slide off, sellers will exceed buyers, and paper profits will begin to disappear. Then there will immediately be a stampede to save what paper profits then exist.” – Roger Babson, September 5th, 1929.
The crash began just a few weeks later…on October 29th, 1929.
Make no mistake. The bulls clearly remain in charge of the market currently. Just don’t fall into the “complacency trap” that such will always be the case. This is why having some method of managing risk is critical to long-term investment success.
Market and Sector Analysis
Data Analysis Of The Market & Sectors For Traders
S&P 500 Tear Sheet
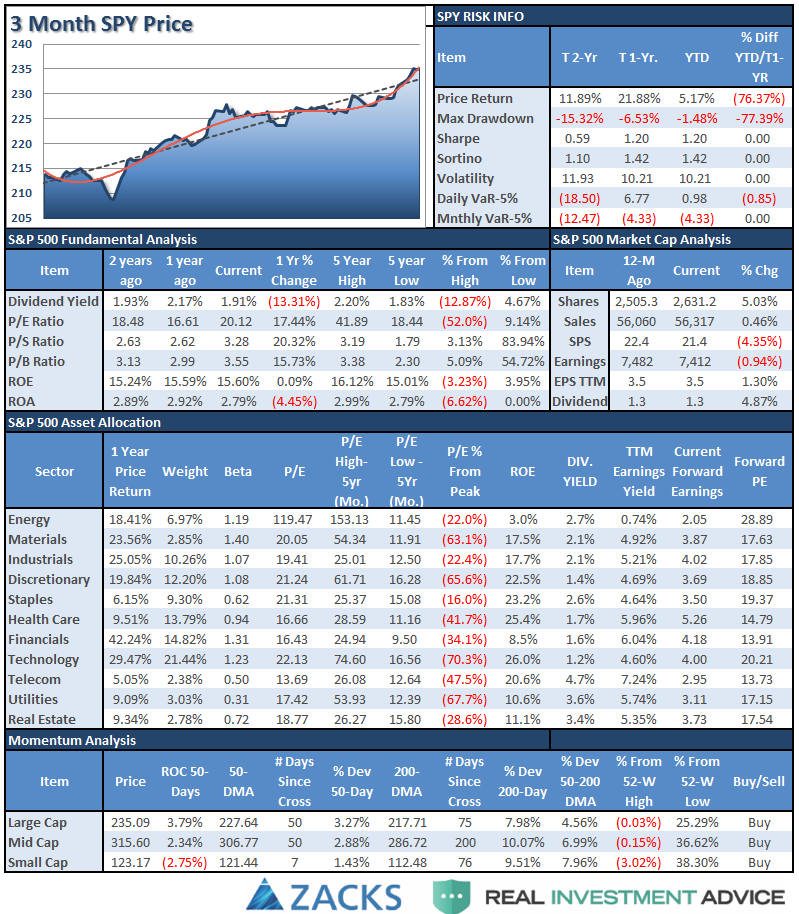
The “Tear Sheet” below is a “reference sheet” provide some historical context to markets, sectors, etc. and looking for deviations from historical extremes. If you have any suggestions or additions you would like to see, send me an email.
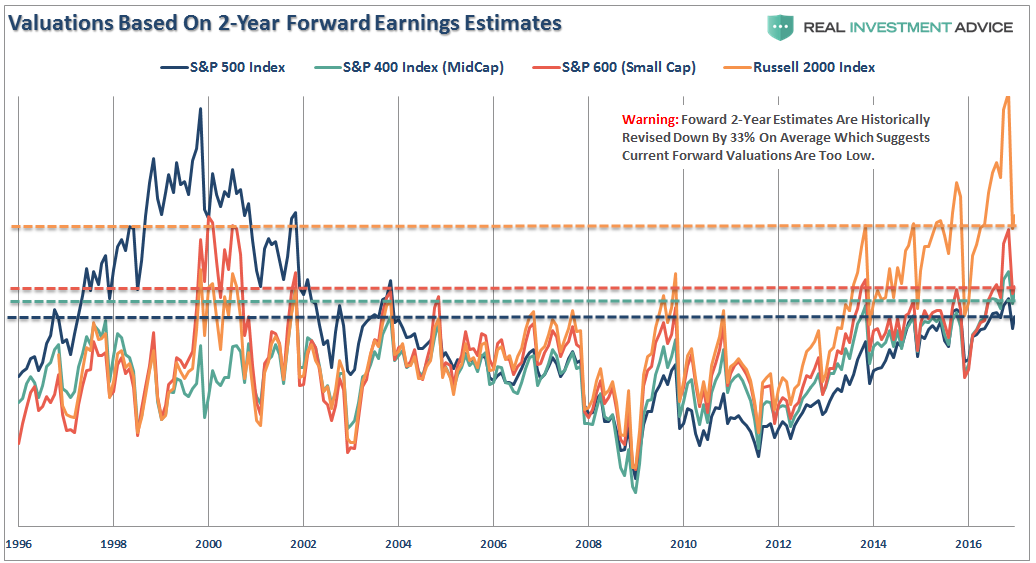
The chart below shows valuations for the S&P 500, 400, 600 and Russell 2000 based on FORWARD 2-Year Estimates. For example, the latest reading for the S&P 500 P/E ratio is based on the current price divided by 2018 earnings estimates.
Currently, with the exception of the S&P 500, all other indices are trading at or near the highest levels since the “dot.com” crash.
Sector Analysis
The Rotation Is Now Accelerating
Over the last couple of months, I have been discussing the coming rotation of the “risk on” versus the “risk off” sectors in the market. As I noted (with a video) at the beginning of the year, these rotations usually are early indicators of a “risk off” transition and provide opportunities for investors.
Here is the rotation chart from January 5th.
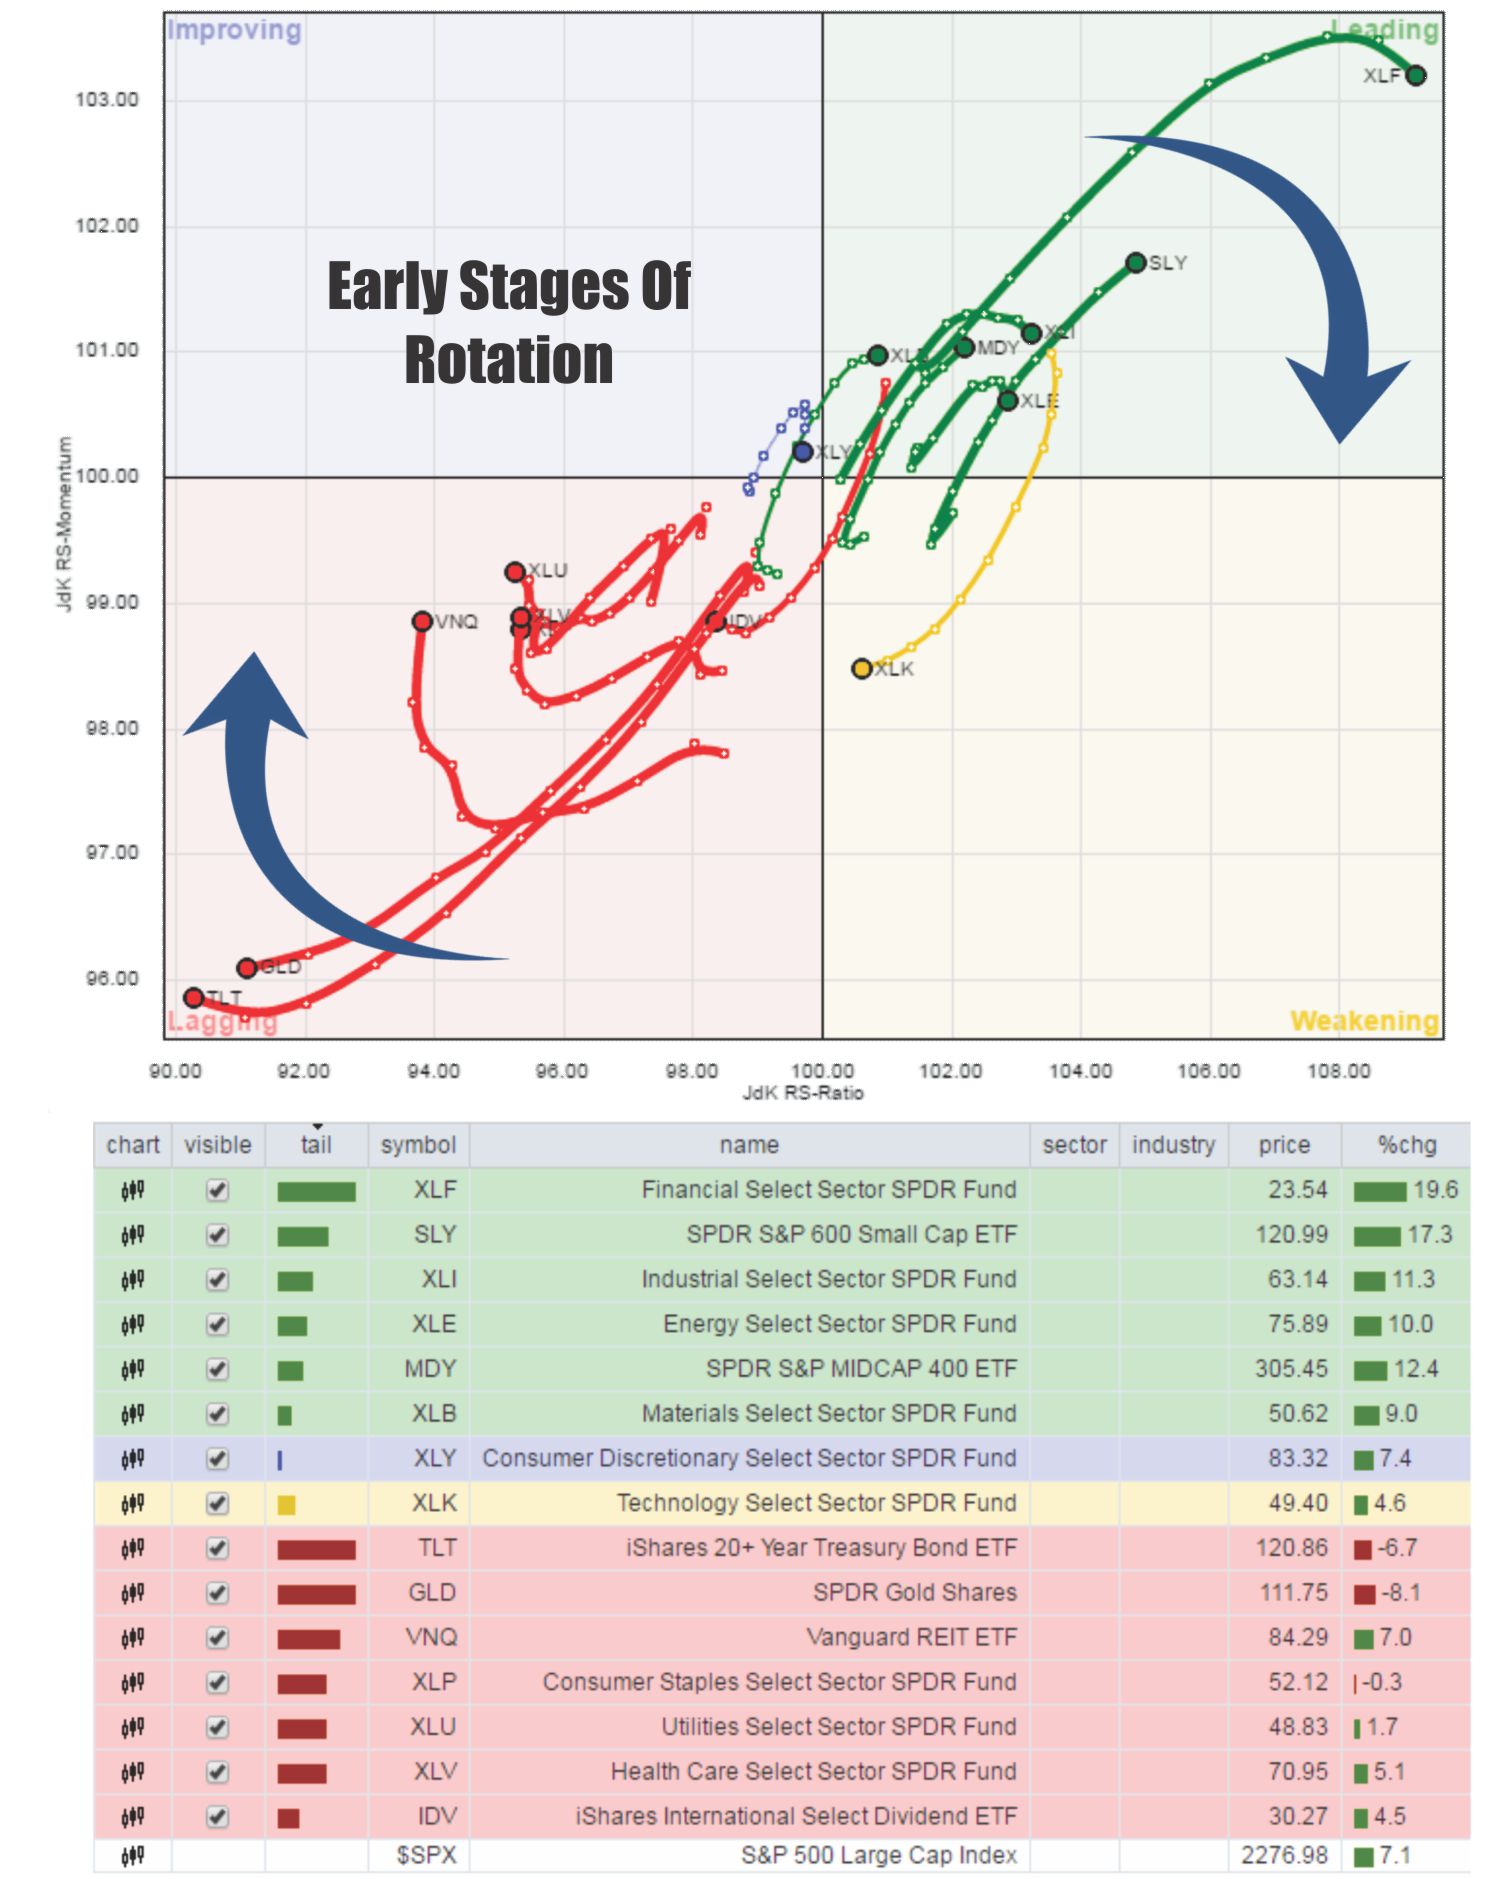
As you can see, that rotation has continued to accelerate since then as expected.
Portfolio Note: Two weeks ago I made two adjustments to the model below so it will align more closely with our actual portfolio allocations. I have swapped IDV for VEA and added VWO. Due to the weight of our portfolio hedges in portfolios currently, we are using a position in IWM as a proxy for MDY and SLY.
Portfolios reside at our maximum portfolio equity weightings including hedges currently.
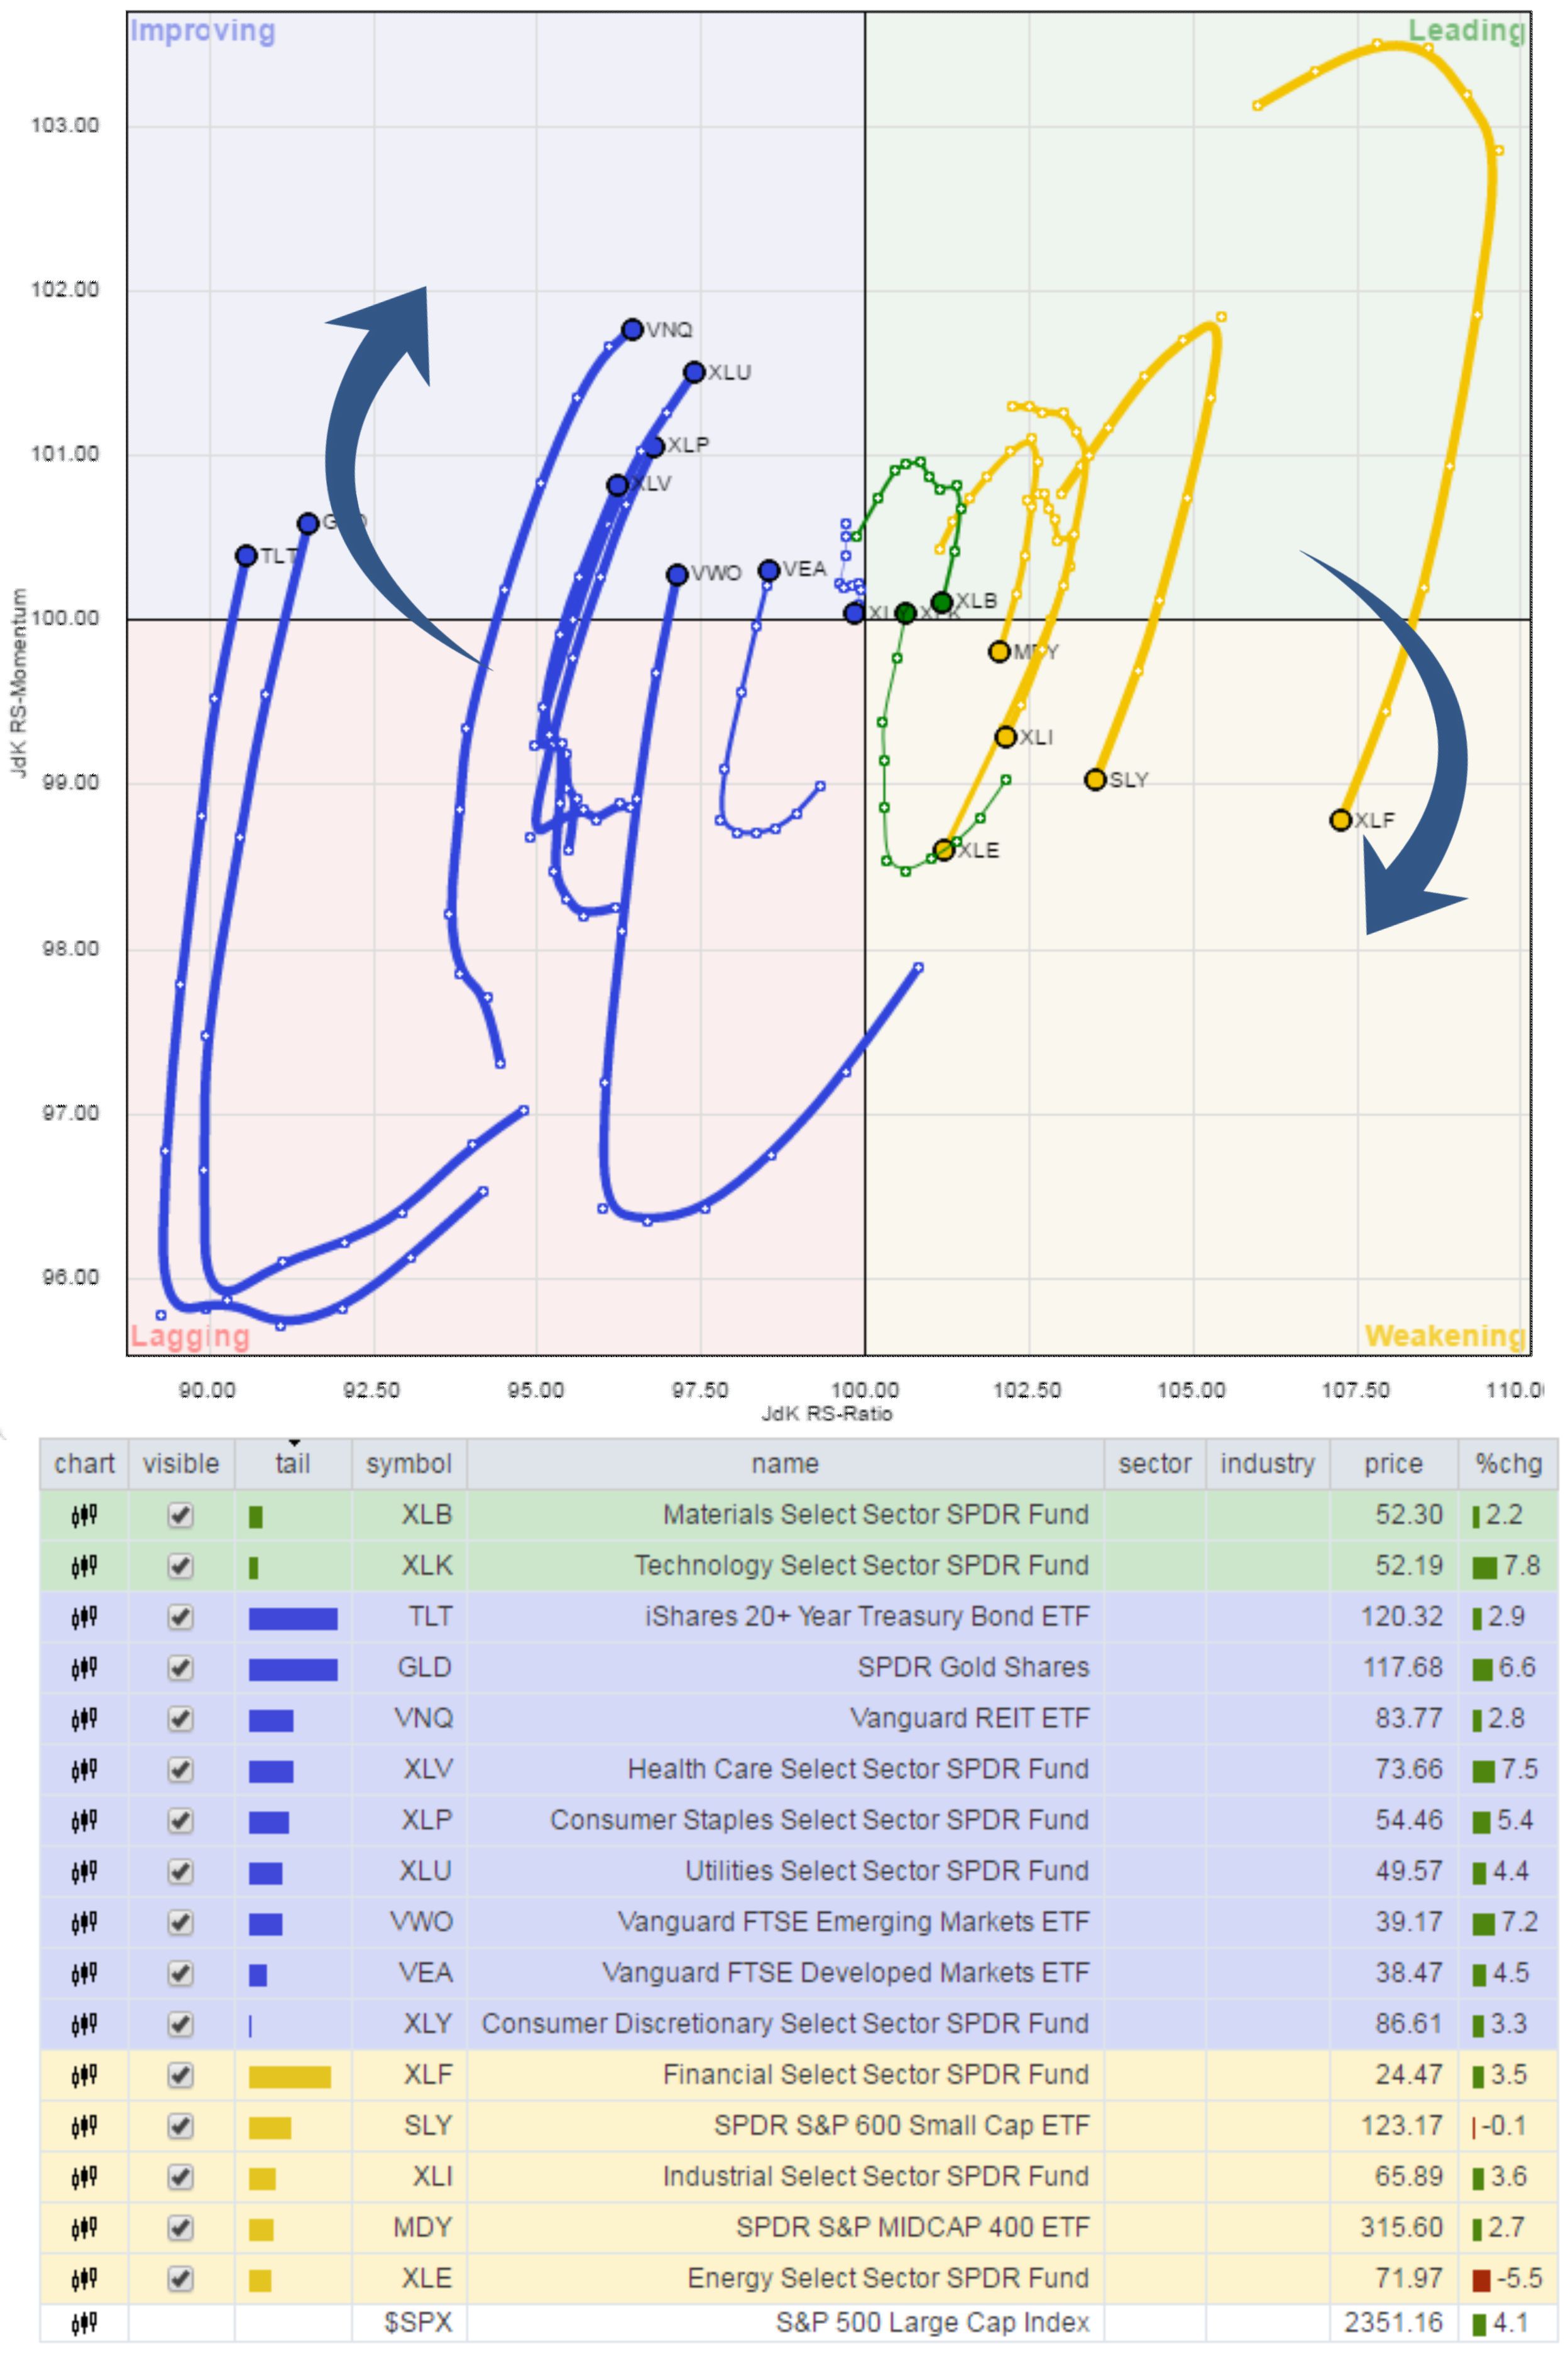
This rotation is still likely early in its movement. As noted previously, when the “Trump exuberance trade” reached its peak post-election, the rotation trade became very obvious. As noted at the beginning of this missive, from a historical viewpoint, corrections in the month of February tend to amass towards the end of the month.
In other words, don’t let this past week’s rally fool you. It is historically very well aligned with normal early February advances. The “risk off” trade is likely telling us something more important.
Technology (via Technology Select Sector SPDR (NYSE:XLK)), Discretionary (Consumer Discretionary Select Sector SPDR (NYSE:XLY)), Industrials (Industrial Select Sector SPDR (NYSE:XLI)), Staples (Consumer Staples Select Sector SPDR (NYSE:XLP)), Utilities (Utilities Select Sector SPDR (NYSE:XLU)), Health Care (Health Care Select Sector SPDR (NYSE:XLV)) and Financials (Financial Select Sector SPDR (NYSE:XLF)) continue to push highs. Energy (Energy Select Sector SPDR (NYSE:XLE)) continued to struggle after breaking its 50-dma. Basic Materials (Materials Select Sector SPDR (NYSE:XLB)) lagged but held its ground.
Notably, watch Utilities ( via Utilities Select Sector SPDR (NYSE:XLU)) as the 50-dma is heading back up suggesting a cross of the 50-200 dma is likely. The same goes for Staples and Healthcare.
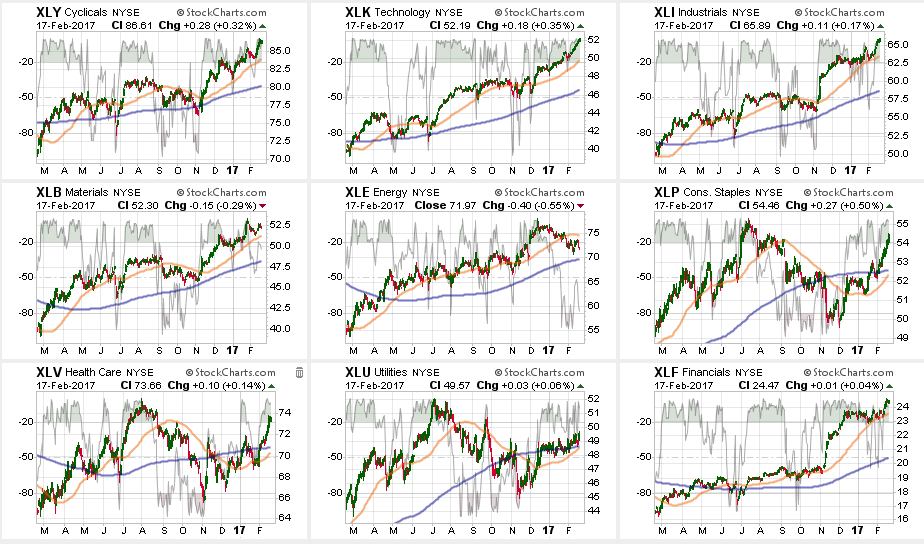
From the broader index positioning:
Small Caps (via S&P 600), REITs (via Vanguard REIT (NYSE:VNQ)), Mid Caps (via MDY), and Dividend Stocks (via IDV) bounced off their respective 50-dmas BUT are all extremely extended above their longer-term moving averages suggesting a higher degree of risk.
Emerging (via iShares MSCI Emerging Markets (NYSE:EEM)) and International (via iShares MSCI EAFE (NYSE:EFA)) markets got a lift from the weakening dollar which prompted an increase in International weightings in portfolios two weeks ago from a trading perspective. These areas are also extremely overbought currently as well. Caution is advised.
Like Utilities, Staples and Healthcare above, watch REITs where the 50-dma is about to cross above the 200-dma which should provide for additional support for the sector.
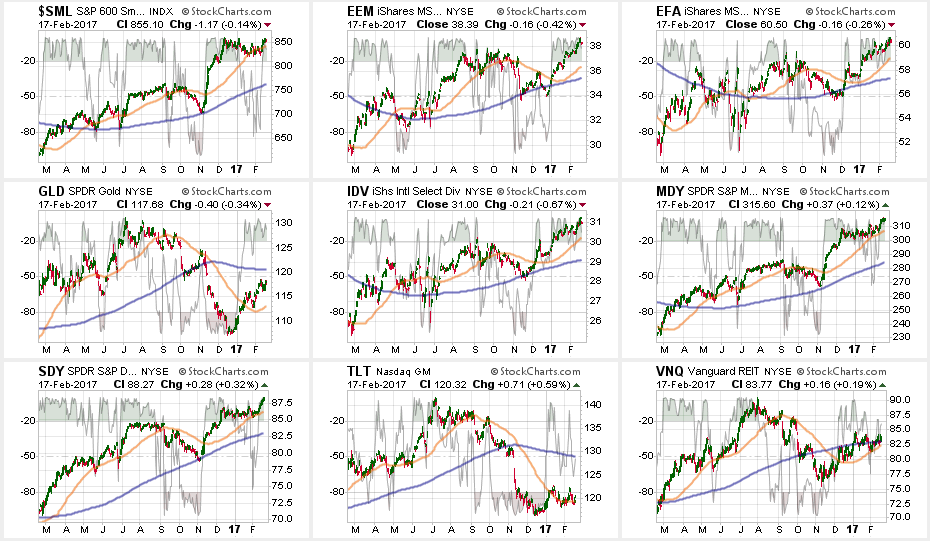
The table below shows thoughts on specific actions related to the current market environment.
(These are not recommendations or solicitations to take any action. This is for informational purposes only related to market extremes and contrarian positioning within portfolios. Use at your own risk and peril.)
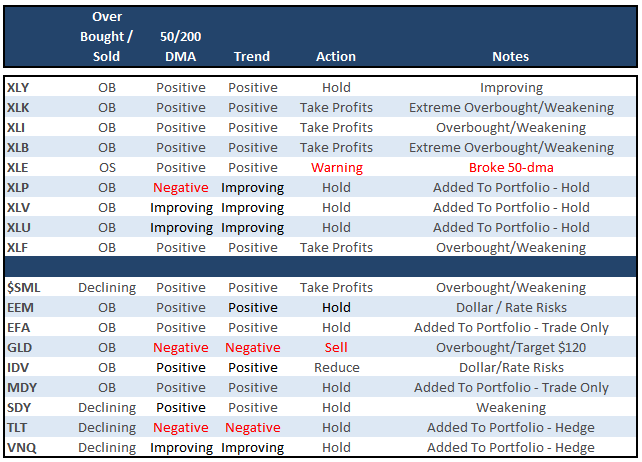
Portfolio Update:
Ten weeks ago, as suggested, we hedged our long-equity positions with deeply out-of-favor sectors of the market (Bonds, REITs, Staples, Utilities, Health Care and Staples) which have continued to perform well in reducing overall portfolio volatility risk.
As noted two weeks ago, we added two new positions from a “Trading” perspective only: IWM – Russell 2000 and VEA – International
The short-term bullish trend and technical setup required an increase in equity risk in portfolios. However, all positions maintain very tight trailing stops as the mid to longer-term dynamics of the market continue to remain very unfavorable.
No new additions to equity are currently recommended as risk/reward remains unfavorably balanced going into next week. Rebalancing remains strongly advised.
