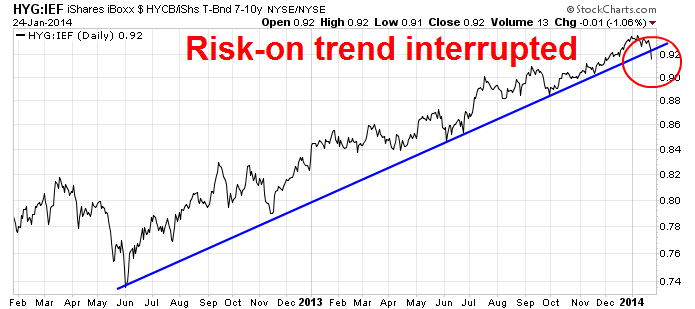
I know that I had said that the week after option expiry tends to have a negative bias and I expected some stock market weakness last week (see A minor pullback, then...), but the pullbacks on Thursday and Friday were sudden and swift. By mid-day Friday, my trend following models, which are always late by design but intended to spot longer dated market moves, were flashing urgent caution signals.
"Fear curve" indicator oversold
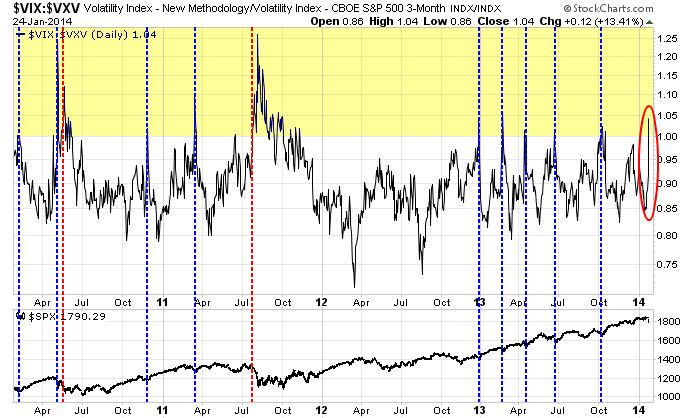
A review of the short and intermediate term indicators this weekend, however, suggest that equity markets are due to stage an oversold rally next week. First of all, the term structure of the "fear curve" is flashing an oversold signal. The chart below shows the VIX/VXV ratio shows that the term structure of the VIX has inverted. On Friday, we saw an inversion as VIX close higher than three-month volatility (VXV).

In the last three years, there have been ten occasions, excluding the current, where the term structure of VIX has inverted (yellow zone). Eight of those occasions have signaled a short term market bottom (blue vertical lines).
Only two of the ten cases have marked further stock market declines (red vertical lines). The first, in 2010, prices did fall a little and then flattened out. The second and most notable decline occurred in the summer of 2011, which was plagued by the combination of a deadlock in Washington and the eurozone crisis - a vast difference in macro tail-risk compared to today.
That's a 80% batting average for the bulls. Does any bear out there wants to bet against those odds?
Positive breadth intact
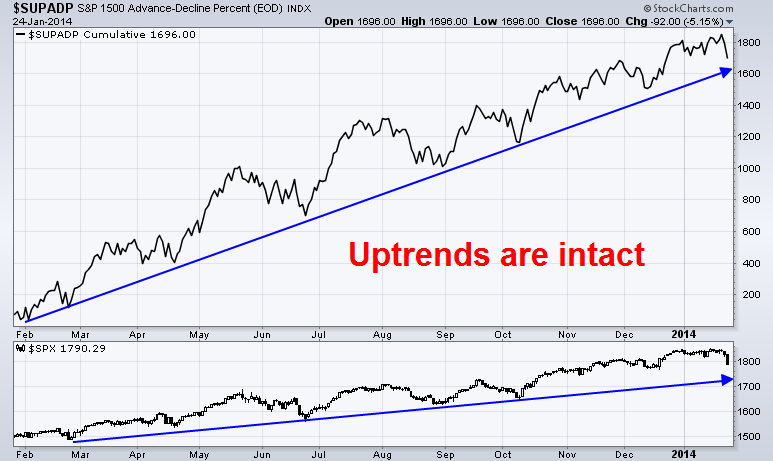
In addition, an analysis of the SP1500 advance-decline line shows this breadth indicator's uptrend is still intact and supportive of further advances in stock prices.

In conclusion, I believe that the suddenness and violence of the two-day stock market downturn are suggestive that prices are likely to bounce next week - at least until Wednesday when the FOMC announces its decision.
I will be watching two things. First, can the bears follow through with further weakness? As well, how will sentiment measures developing? The persistence of bullish sentiment will be contrarian bearish, while an upsurge in bearishness would be supportive of further stock market strength.
Disclosure:Cam Hui is a portfolio manager at Qwest Investment Fund Management Ltd. (“Qwest”). The opinions and any recommendations expressed in the blog are those of the author and do not reflect the opinions and recommendations of Qwest. Qwest reviews Mr. Hui’s blog to ensure it is connected with Mr. Hui’s obligation to deal fairly, honestly and in good faith with the blog’s readers.”
None of the information or opinions expressed in this blog constitutes a solicitation for the purchase or sale of any security or other instrument. Nothing in this blog constitutes investment advice and any recommendations that may be contained herein have not been based upon a consideration of the investment objectives, financial situation or particular needs of any specific recipient. Any purchase or sale activity in any securities or other instrument should be based upon your own analysis and conclusions. Past performance is not indicative of future results. Either Qwest or I may hold or control long or short positions in the securities or instruments mentioned.

