There is some talk among traders about precious metals breaking out. Silver broke a trendline dating back to summer 2011 and made its highest weekly close in more than three months. Gold made its highest weekly close in three months and gold miners had a very strong week last week. However, do these moves really register as breakouts? Not quite yet say the charts.
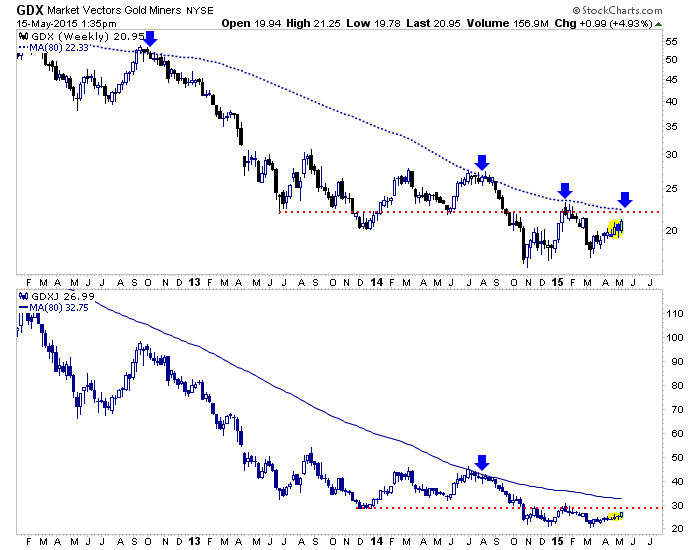
First, let's start with the miners. The weekly candle charts for Market Vectors Gold Miners (ARCA:GDX) and Market Vectors Junior Gold Miners (ARCA:GDXJ) are shown below, along with their 80-week moving averages (in blue) and lateral resistance (in red). For GDX and other indices, the 80-week moving average has perfectly defined bull and bear markets going back five years. If GDX can sustain this strength, then it should test the 80-wma in the weeks ahead for the third time in the past 10 months. There is a major confluence of resistance at $22.
Meanwhile, GDXJ could rally up to $30 or a bit higher before testing major resistance. Miners have more room to rally but there are no breakouts until they take out their 80-week moving averages.
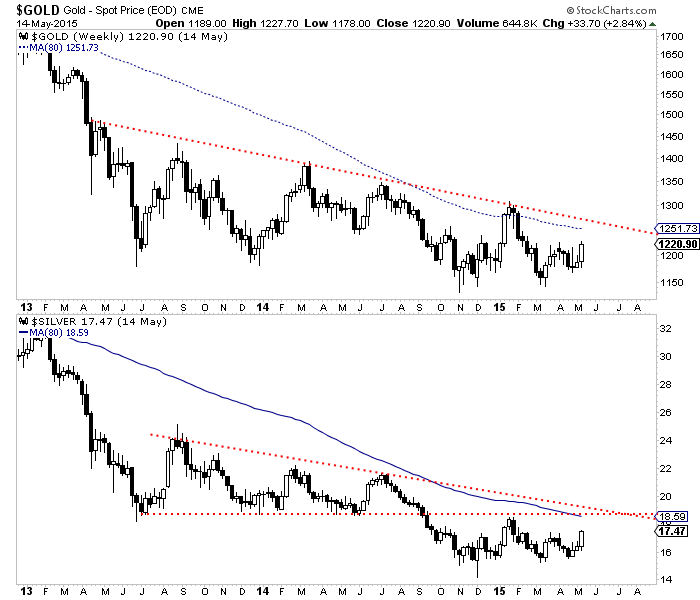
Meanwhile, both metals had strong weeks last week, and made their highest weekly close in several months. While Silver broke a downtrend line dating back to 2011, the real resistance figures to be around $19 where there is a confluence of resistance. For Gold, the confluence of resistance is around $1250. Ultimately, it is hard to see any major breakout in the metals until they surpass their January highs on a weekly or monthly basis. That would be a significant breakout.
The gold miners (because they peaked first and are extremely oversold) can certainly diverge and perform okay if the metals don’t break out. However, we get the sense that they won’t perform really well until the market thinks the metals have bottomed.
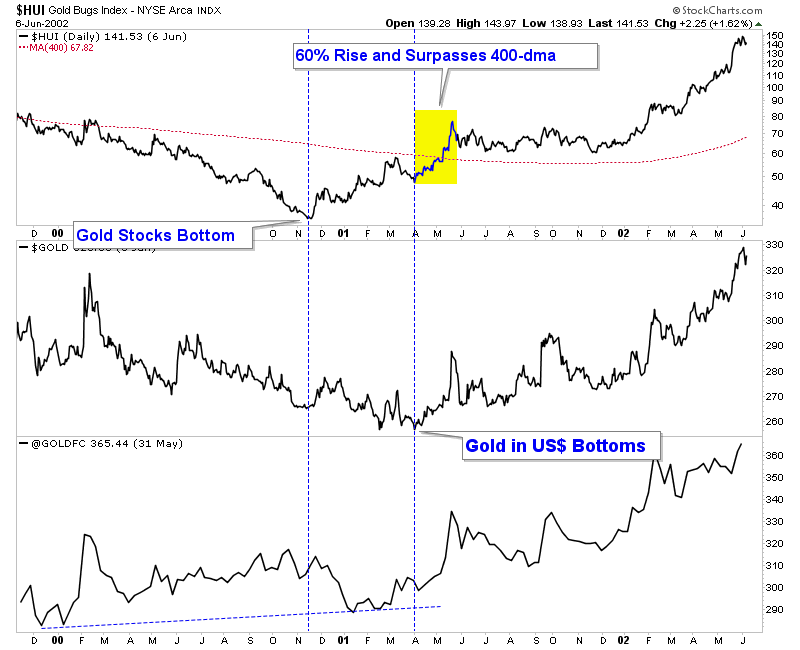
Note what happened during the 2000 to 2001 bottom. Gold against foreign currencies bottomed first followed by gold miners in Q4 2000. Note that after Gold bottomed at the end of Q1 2001, the miners surged by 60% in two months and took out that pesky 400-day moving average (equal to the 80-wma).
While the immediate outlook appears to be constructive, the entire complex has a lot of work to do before we can get really excited. The miners could test their 80-week moving averages but it is unlikely they can advance farther unless the metals take out their January highs.
I’m skeptical that metals will do that on this rebound, as their relative performance is weak considering the big drop in the USD. The worst is likely over for the miners, but if Gold can’t reach or take out its January high, then the miners are at risk for remaining in the range they have been in for the past eight months. Until something changes, buying support and oversold conditions works better than chasing strength.


