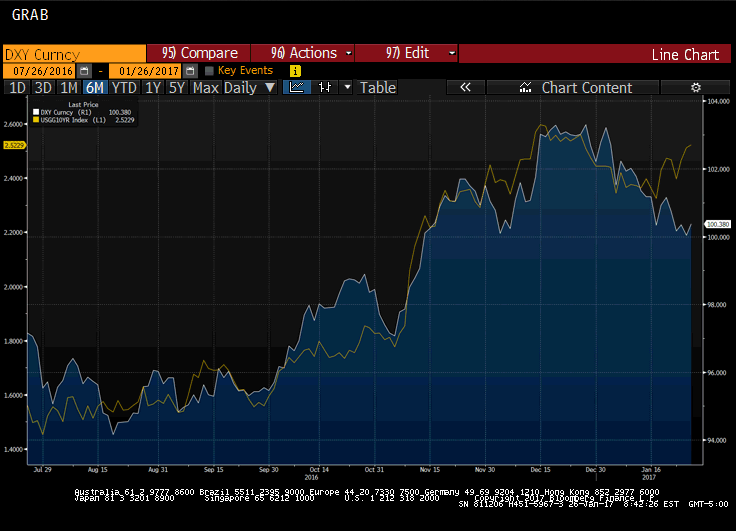
The US 10-year yield is at its high for the year and yet the US dollar has been struggling to gain traction. Some suggest that this means the dollar's rally is over. Charts like this one are circulating among market participants.
This Great Graphic was created on Bloomberg. The white line is the Dollar Index and the yellow line represents the US 10-year yield. The two look highly correlated over the past six months -- until very recently.

We are not convinced. First, one can see on the chart other times over the past six months where the relationship looked less tight but did not signal a change in drivers. Second, correlation is not something that can always we eyeballed, especially when the chart shows two time series with two different scales. It could be an exercise in curve fitting.
We ran the correlation calculation on the basis of the percent change in the Dollar Index and US yields. Over the past 60 days, the correlation is 0.61. It has been fairly stable since the middle of October (weeks before the US election). At the end of January 2016, the correlation was negative. The correlation over the past 30 days is 0.66. That is to say that the correlation is higher for the more recent period than the earlier period picked up by the 60-day correlation.
As you recall, the Dollar Index is heavily weighted to the euro and currencies that move in its orbit, like the Swiss franc and Swedish krona. We took a closer look at the correlation between the dollar-yen and the US 10-year yield. The pattern is the same, in that the correlation is higher for the short-term period than the longer one. Specifically, again on the percent change basis, the dollar-yen rate and the 10-year yield has almost a 0.68 correlation over the past 60 days but almost a 0.86 correlation over the past 30 days. As a general rule, running a correlation on less than 30 data points is not regarded as sufficiently robust.
We have often found a fairly good fit between the US and German two-year interest-rate differential and the euro-dollar exchange rate. This relationship also remains intact. Again, we conducted the correlation on the basis of percent change. Over the past 60 days, the correlation between the percent change in the euro and the two-year differential is about 0.65. Over the past 30 days, the correlation is near 0.73.
One difference between rising yields today and late 2016 is that the global move is not being driven by the US. Consider that here in January, the US 10-year yield is up eight basis points. The German 10-year yield is up 27 bp, France is up 30 bp, and the UK is up 26 bp. Similarly, at the two-year tenor, the US yield is up five basis points this year, while German two-year yield is up 16 bp, France is up 22 and the UK 15 bp.
We want to be sensitive to the possibility that dollar drivers change. However, we are not convinced that this is the case. The correction to US interest rates began the day after the FOMC hiked rates on December 14. Solid growth in the US and rising inflation expectations will underpin US yields and allow the dollar to recover when the correction is over. Our work with technical indicators suggests that turn is nearby.
