Get 40% Off
⚠ Earnings Alert! Which stocks are poised to surge?
See the stocks on our ProPicks radar. These strategies gained 19.7% year-to-date.
Unlock full list

Are Global Equity Markets About To Take A Dramatic Surge Higher?

Published 10/25/2019, 03:16 AM
Updated 09/20/2023, 06:34 AM

This post was written exclusively for Investing.com

The S&P 500 may not be the only index that seems on the verge of a massive break out. The iShares MSCI ACWI ETF (NASDAQ:ACWX), which is a proxy for the MSCI ACWI Index, appears to be on the cusp of a big break out of its own. The ETF topped out in January of 2018 and has traded sideways ever since. It is, quite literally, trading at nearly the same price today as it did in February 2018.

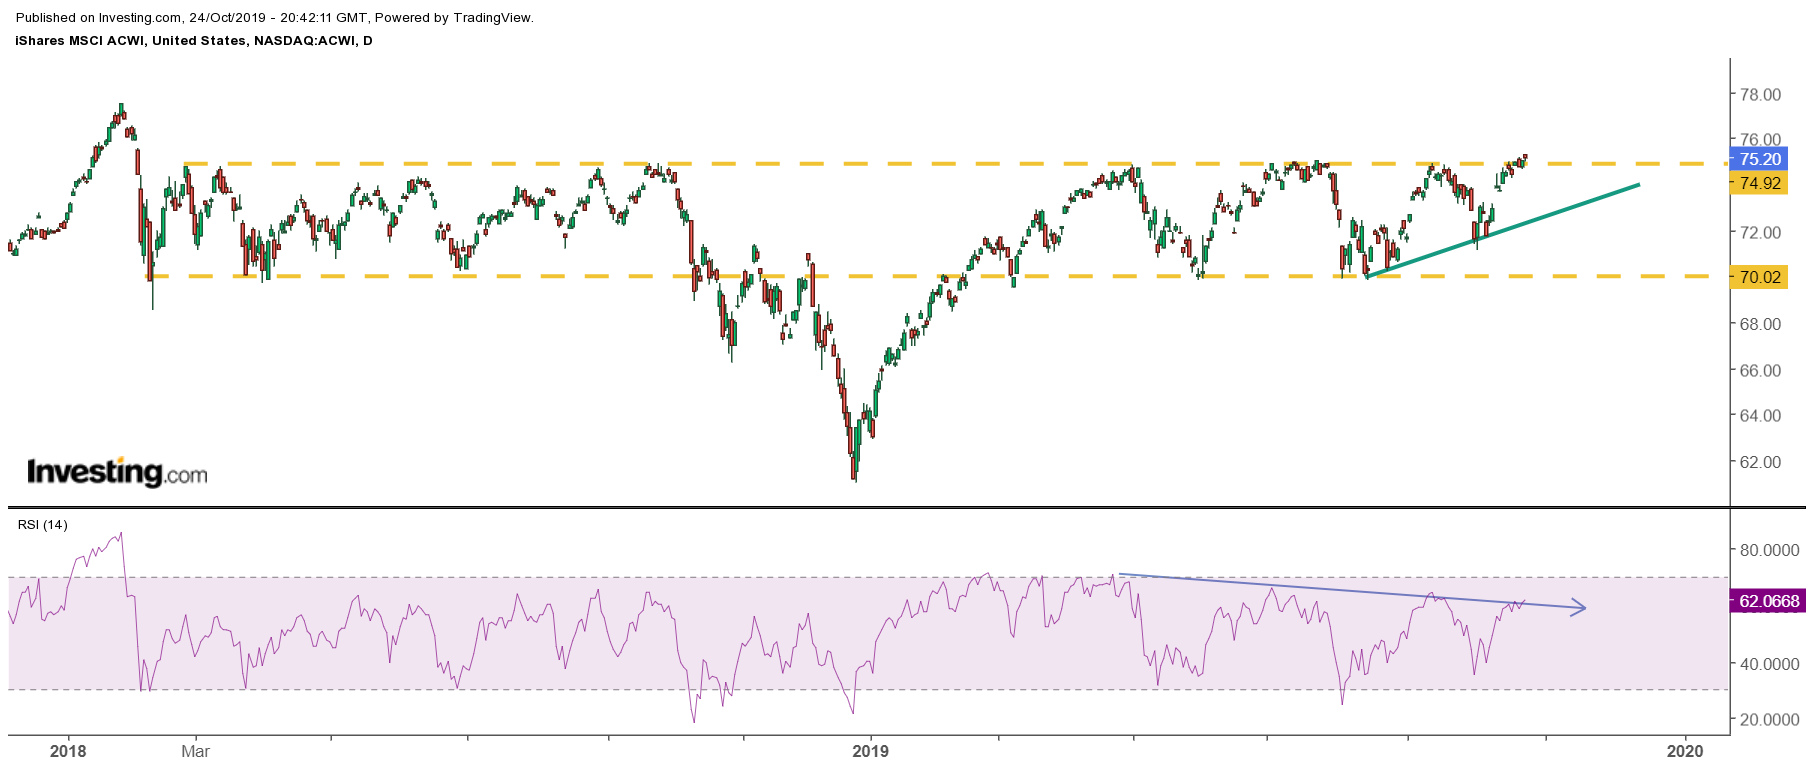
Now, the ETF is knocking on the door of a big break out, having failed to rise above resistance three times at $75.20 since April 2019. To this point it has avoided the dreaded triple-top reversal pattern. It means the ETF is very close to rising back to its all-time highs of around $77.70 and possibly pushing beyond. Since Feb. 1, 2018 the ETF is down 1.3%, versus the SPDR S&P 500 ETF’s (NYSE:SPY) gain of about 6.5%.

A Big Break Out Approaches

The chart shows that the ETF has essentially traded in a range of $69.75 to $75.20 since February 2018, except for the drawdown in the fourth quarter of 2018. The region around $75.20 has acted as a very strong level of resistance for the ETF since May 2019.
iShares MSCI ACWI ETF

The ETF has reached technical resistance at the $75.20 level on three occasions in 2018: in May, July, and September. Each time the index failed to rise above the resistance level. Two of those times, in May and in August, it was able to hold technical support at $69.75. However, after the ETF failed at resistance in September, it made a higher low and created the beginning of a new uptrend.

Additionally, with the ETF now attempting to break out for the fourth time, the chances it will happen are rising. That is because the ETF was able to avoid a bearish reversal pattern known as a triple top. Generally, on the fourth attempt stocks and indices tend to push through resistance.

Also, the relative strength index is showing that bullish momentum in the ETF is building, as It has slowly been rising and is very close to breaking a downtrend of its own.

Ex-U.S. is Nearing A Breakout Too?

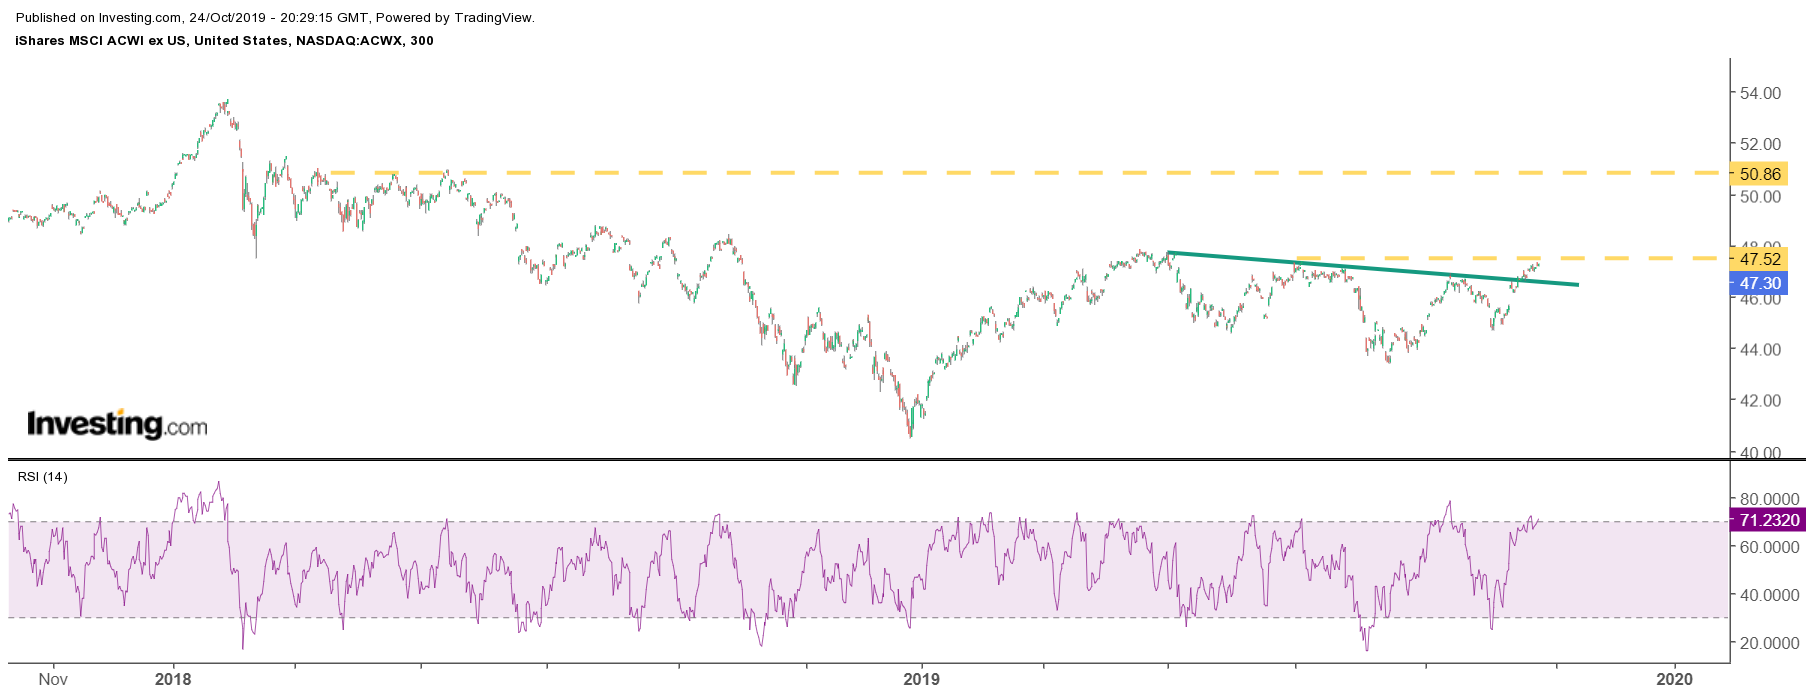
Interestingly, the iShares MSCI ACWI ex US (NASDAQ:ACWX) is showing similar bullish trends. Although the chart does look different, it shows that the ETF has recently broken a downtrend. However, the ETF is confronted with a region of resistance between $47 and $48. If that region can be cleared, it seems like the ETF could go on to rise to around $50.75.
iShares MSCI ACWI ex US

Overall, the trends in the market appear to be bullish — and, in some cases, very bullish. It feels as if the market is waiting for something to take its next giant leap higher. Perhaps that big jump comes in November following the next FOMC rate decision, third quarter earnings or following China's President Xi and U.S. President Trump’s meeting at the Asia-Pacific Economic Cooperation (APEC) in Chile the week of Nov. 11.

750 Points?

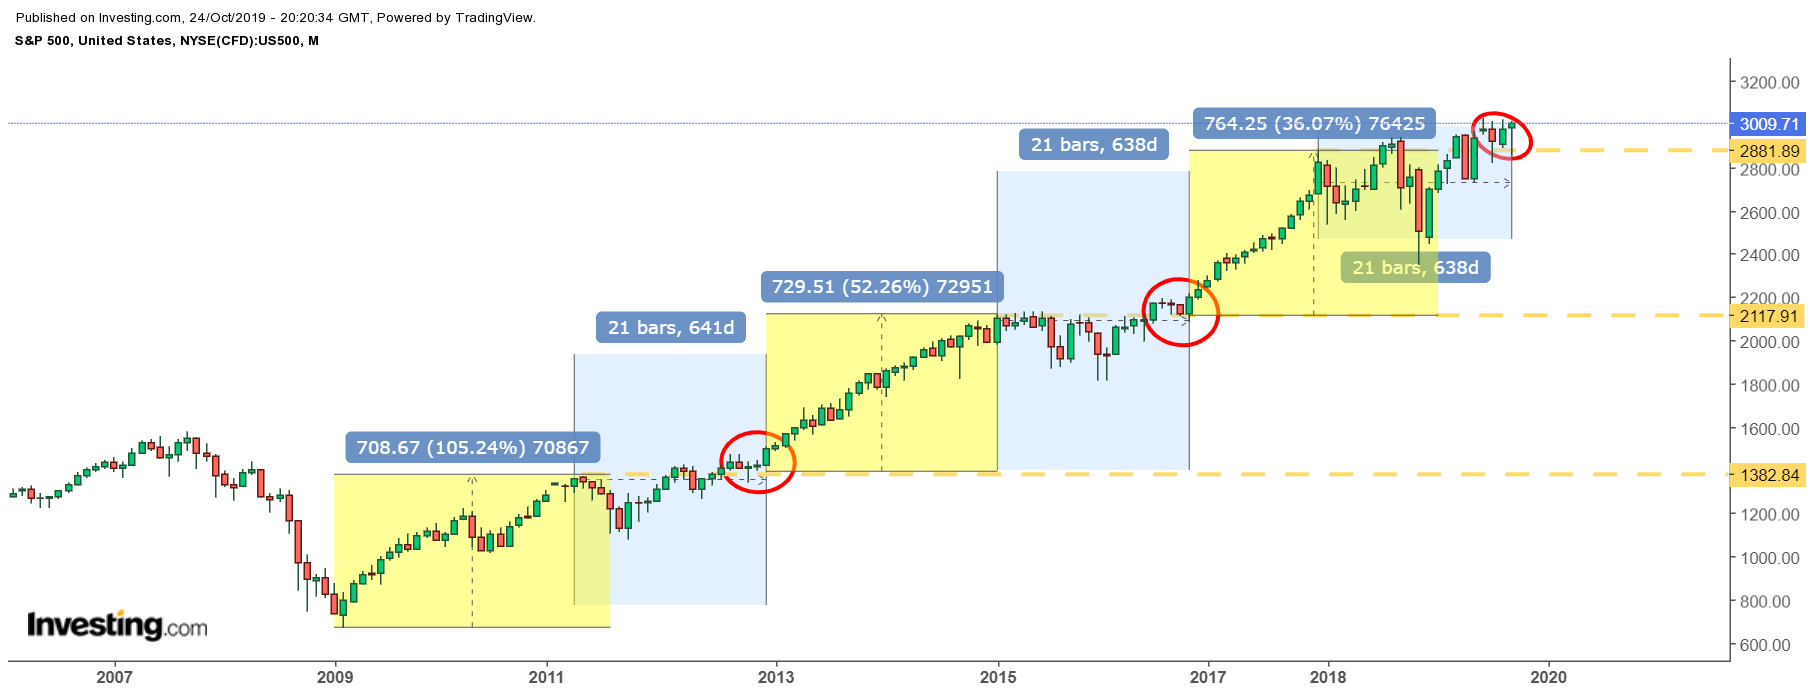
As we move closer to a potential market break out for the S&P 500 and the global markets, another glaring observation becomes apparent, going back to the year 2009. Each time the S&P 500 did rally following a consolidation period, as discussed last week, the S&P 500 increased by nearly the same amount, around 725 to 750 points.
S&P 500

Only time will tell if the next major leg of the bull market is upon us, defying many of the skeptics. While it is impossible to know for sure what happens next, it sure is a lot of fun finding all the pieces and then putting them all together.

Latest comments

lol s&p rally for 10 months already its more melt up and crash like last year or do a technical recession and avoid an new financial crisis the ball is in the side of the traders im short on cac and aex but all 2 on tops with no reason just hope u cznt hold these stands u need fundament for it
Michael Kramer.Albeit the global outcry of recession the fact that the market has invalidated the triple top violently lends credence to your belief that the index is poised to attain crazy highs and stun the bears. US China trade optimism strengthens the bullish probability.But hey markets are notorious to intimidating the logics more often than not. What if it's a black Monday?
I can not agree with you, the market will repeat 2007, and enter reccession next year!
I think your ticker is wrong?
repo markets is 1 thing last timd 2008 do i need to drzw it first before people take security and taking profits?
hope pushes everything up reality will give crash just wait for it
Black monday anytime
It s going for a mega plunge
ISM was pretty negative BUT the market does not care . The market knows for sure the FED will give more QE more rate cuts to keep it  going . Then the next ISM or any other True World data will go negative BUT the market will choose to ignore it . How long those 2 separate planets can spin ?
the stock market is in same exact spot like last year it can crash easily
whenever I see these articles Im tempted to do the exact opposite. Something tells me I have got to sell.
if it does then markets show we gonna have financial crisis
Yeah, more like dramatic breakdown.
This guy is probably the only one that's right.
The audience have better sense than this guy.
Apparently not
why do they let this guy write articles? literally dismisses anything that has common sense or logic attached to it
By what MIRACLE?
thanks
Good article. I like your cyclical analysis on economy.
Risk Disclosure: Trading in financial instruments and/or cryptocurrencies involves high risks including the risk of losing some, or all, of your investment amount, and may not be suitable for all investors. Prices of cryptocurrencies are extremely volatile and may be affected by external factors such as financial, regulatory or political events. Trading on margin increases the financial risks.
Before deciding to trade in financial instrument or cryptocurrencies you should be fully informed of the risks and costs associated with trading the financial markets, carefully consider your investment objectives, level of experience, and risk appetite, and seek professional advice where needed.
Fusion Media would like to remind you that the data contained in this website is not necessarily real-time nor accurate. The data and prices on the website are not necessarily provided by any market or exchange, but may be provided by market makers, and so prices may not be accurate and may differ from the actual price at any given market, meaning prices are indicative and not appropriate for trading purposes. Fusion Media and any provider of the data contained in this website will not accept liability for any loss or damage as a result of your trading, or your reliance on the information contained within this website.
It is prohibited to use, store, reproduce, display, modify, transmit or distribute the data contained in this website without the explicit prior written permission of Fusion Media and/or the data provider. All intellectual property rights are reserved by the providers and/or the exchange providing the data contained in this website.
Fusion Media may be compensated by the advertisers that appear on the website, based on your interaction with the advertisements or advertisers.
© 2007-2024 - Fusion Media Limited. All Rights Reserved.