The coronavirus crisis reordered many things in economics and finance and you can add asset correlations to the list.
After markets crashed in March, followed by a strong (so far) rebound, asset classes have continued to move with an unusually deep and broad degree of unison. High, or at least higher return correlations aren’t unusual around periods of severe market corrections. The question is whether it’s different this time in the sense that the jump in correlations endures?
The answer, of course, is unknown for the usual reason: the future is as uncertain as ever. But in the current climate, it’s reasonable to wonder if the standard ebb and flow of correlations that usually prevails has given way to return relationships that remain tightly linked for longer or perhaps even permanently.
This is more than an academic question since higher correlations imply lower benefits from asset-class diversification. In turn, the change translates to higher portfolio risk and incentivizes the search for alternative risk-management techniques to pick up the slack.
The raw material that arguably has contributed to what may be a regime shift for correlations start with the arrival of extraordinarily dovish monetary and fiscal stimulus programs the world over. As The Economist this week observes,
“The pandemic has accelerated a rethink of macroeconomics. It is not yet clear where it will lead.”
This change has been brewing for a decade, ever since central banks and governments responded to the 2008-2009 financial crisis. The stimulus never really went away, although it did fade in varying degrees around the world. But when the coronavirus shuttered much of the global economy earlier this year, the focus shifted back to dovish policies and to a degree that’s unprecedented. Given how deep the world has gone down the monetary and fiscal rabbit hole in 2020, it’s unclear how soon, if ever, the global economy will return to “normal.”
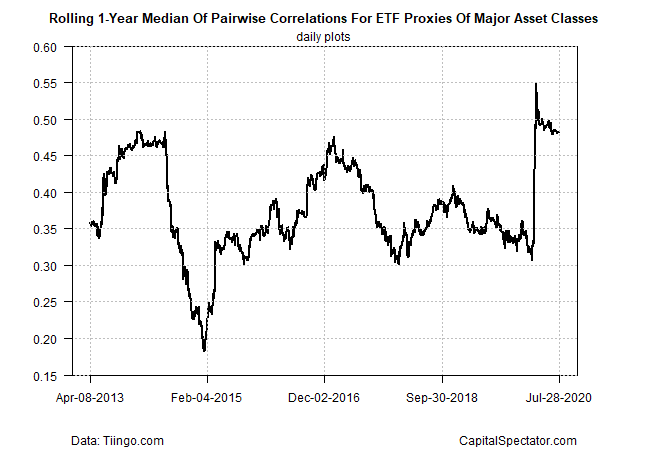
As for what we do know, correlations between the major asset classes spiked earlier this year following the market meltdown. Although the surge has faded a bit in recent months, it remains sticky at a relatively high level.
As a benchmark, consider the median of the rolling one-year correlation for the major asset classes (based on daily returns) via a set of proxy ETFs. Surging to 0.55 earlier in 2020, the median’s retreat has been modest and so correlations remain elevated. (Note: correlation readings range from -1.0 (perfect negative correlation) to zero (no correlation) to +1.0 (perfect positive correlation.)
For a more granular profile, let’s focus on a select group of return pairings between the US stock market and foreign equities in developed and emerging markets, along with US bonds. Using ETF proxies, the chart below shows that correlations remain high, based on rolling 1-year windows.
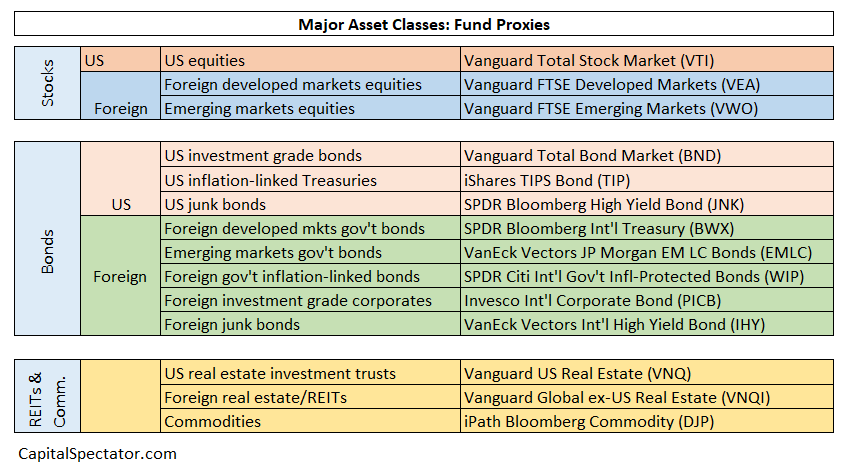
For a deeper review, consider how a broader set of ETF proxies for the major asset classes stack up, based on the following funds:
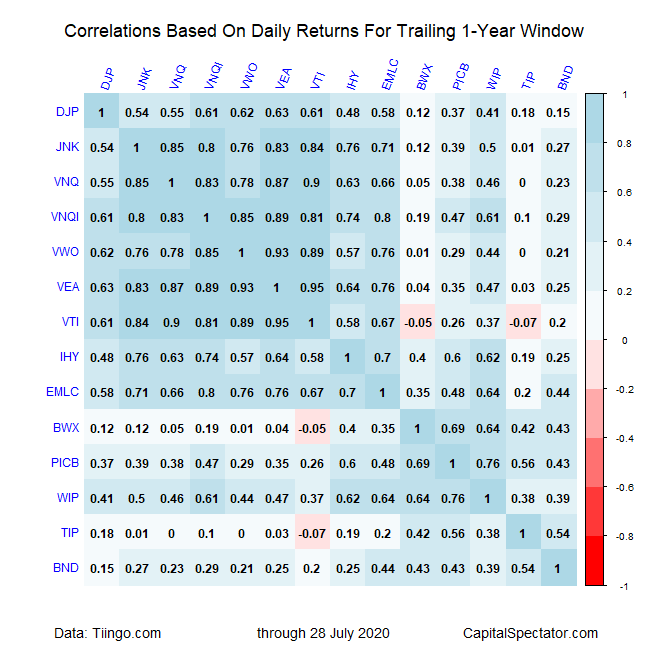
For a large share of fund relationships, correlation remain high via daily returns for the tailing one-year window through yesterday, July 28 (darker squares indicate higher correlations). The main exceptions: bonds vs. stocks. No surprise there, but monitoring how the stock-bond correlations evolve relative to history will be crucial in the months ahead. The main question: has the historical correlation given way to consistently higher readings? There’s still correlation capacity in stock-bond mixes, or so recent history suggests, but the degree of that capacity may have faded.
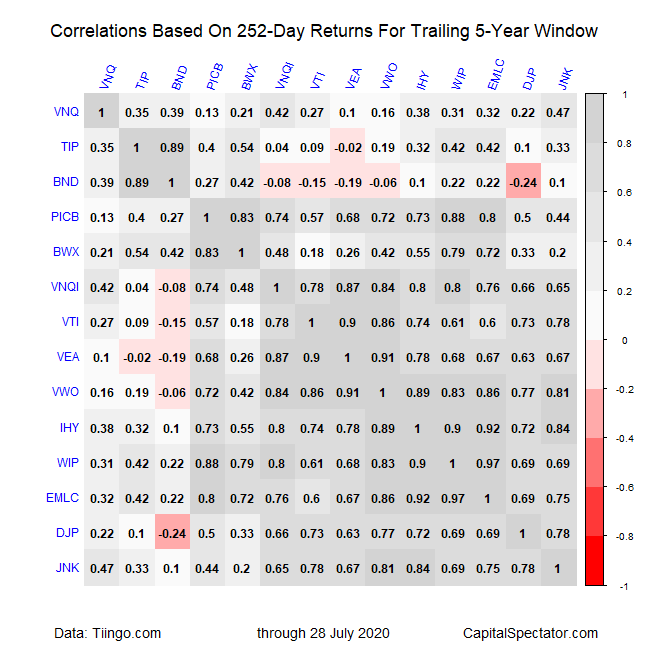
For another perspective, the next table maps all the pairwise correlations for daily returns for a longer horizon: the current five-year trailing window. Here, too, there’s a clear bias to relatively high correlations.
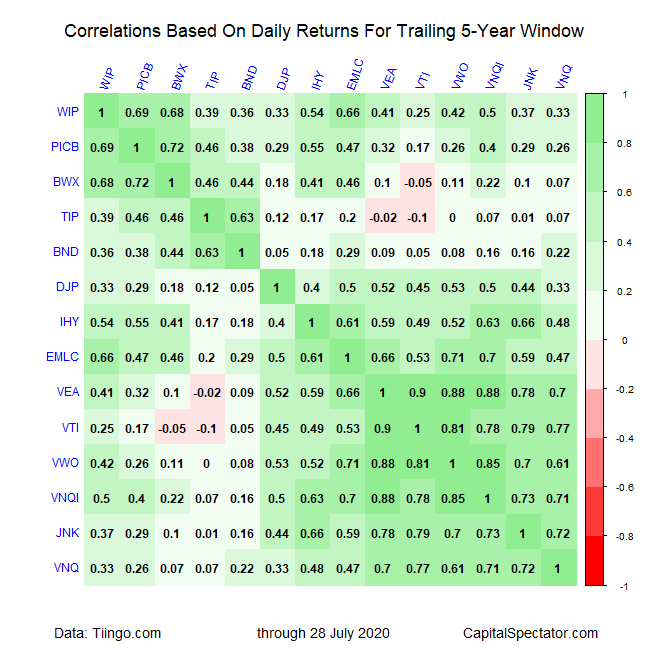
Finally, let’s lengthen the return window to one-year returns (252 trading days) to calculate correlations over the trailing five-year period through yesterday. Once again, relatively high correlations (darker squares) dominate the matrix. The implication: it’s getting tougher to obtain diversification benefits by holding a multi-asset portfolio.
