Semiconductor equipment maker Applied Materials (NASDAQ:AMAT) shares have been underperforming the benchmark S&P 500 index. While the semiconductor stocks have been split between the haves and have nots, the one thing that is core is the need for the equipment to design, develop, and test the chips to ensure functionality.
Applied Materials should be a core holding for investors that want to participate in the upside of the semiconductor industry without the volatility. The stay-at-home lockdowns during the pandemic peak bolstered demand for chips surging shares, but the rumored China “blacklist” triggered a panic sell-off providing opportunistic pullback entries for risk-tolerant investors.
Q3 FY 2020 Earnings Release
On Aug. 13, 2020, Applied Materials released its fiscal third-quarter 2020 results for the quarter ending July 2020. The Company reported an earnings-per-share (EPS) profit of $1.06 excluding non-recurring items versus consensus analyst estimates for a profit of $0.95, beating estimates by $0.11. Revenues grew 23.4% year-over-year (YoY) to $4.40 billion beating analyst estimates of $4.18 billion.
The pandemic accelerated chip demand due to work, shop, play, and learn-from-home trends. The Company shipped a significant portion of backlog from Q2 due to COVID-19 supply chain restraints. Current install base is driving a third of total revenues and 60% of Parts and Services revenues are coming through subscriptions.
Q3 2020 Conference Call Takeaways
The Company noted the remote and e-commerce trends fueling the demand during the pandemic and expects demand to continue. Forward growth drivers include growing demand from cloud, automation, internet of things (IoT) and artificial intelligence (AI) adoption.
The Company did note soft demand in the automotive and industrial industries during the stay-in-shelter mandates. As restarts accelerate, clients specializing in those soft sectors should also see the acceleration of demand. The Company notes the slowdown of the traditional 2D Moore’s Law scaling which is fueling the transition to customized solutions including custom-designed silicon and architecture diversification.
Applied Materials has seen strong commitment from its customers for further investment in R&D which lends to its own conviction of expanded foundry/logic spending this year. The Company sees DRAM demand growing. Semiconductor systems top line is up 18% on a trailing 12-month (TTM) basis and will be up 25% by mid-Q4. Their etch revenues will be up nearly 30% in fiscal 2020. Applied Materials is the fastest-growing company in the metrology and inspection market underscored by the nearly 40% YoY growth mid-Q4 in their Process Diagnostic and Control segment.
Raised Guidance
The Company raised its forward guidance for fiscal Q4 with EPS between $1.11 to $1.23 versus $1.02 consensus analyst estimates. Revenue guidance was raised to a range of $4.40 to $4.80 billion versus $4.35 billion analyst estimates.
China Blacklist Rumors
On Sept. 8, 2020, rumors that China may place U.S. semiconductor manufacturers on a blacklist triggered selling across the board on the largest players including Applied Materials, KLA (NASDAQ:KLAC) and Lam Research (NASDAQ:LRCX). It’s known that China wants to buildout their semiconductor industry to become a self-sufficient dominant player. This spawned rumors of China creating its own blacklist in a tit-for-tat.
While headquartered in California, Applied Materials operates throughout Southeast Asia including China. China tensions continued to accrue when the U.S. Commerce Department letter circulated to U.S. technology companies to obtain licenses before exporting certain technology to China’s largest chip maker Semiconductor Manufacturing International. However, this may already be priced in on AMAT shares. Prudent investors can monitor for opportunistic pullback entries during the volatile election period.

AMAT Opportunistic Pullback Levels
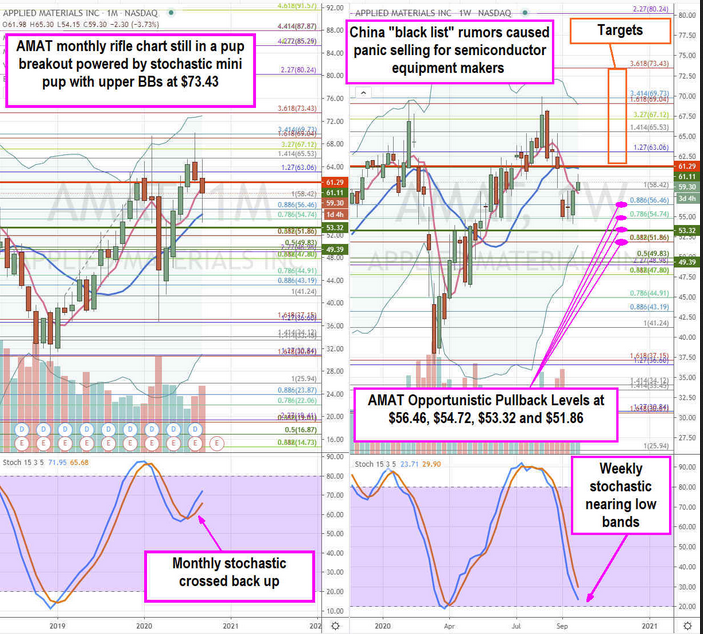
Using the rifle charts on the monthly and weekly time frames provides a broader view of the landscape for AMAT stock. The monthly rifle chart has a bullish pup breakout fueled by the stochastic mini pup driving the rising 5-period moving average (MA) support near the $56.46 Fibonacci (fib) level.
The monthly rifle chart triggered a market structure low (MSL) buy above $53.32. The monthly upper Bollinger Band (BB) is bear the $73.43 fib. The weekly rifle chart formed a market structure high (MSH) trigger under $61.29. This also caused the weekly stochastic to form a full oscillation down as it approached the oversold 20-band and daily lower BBs at the 51.86 fib level.
The falling weekly stochastic may provide opportunistic pullback levels at the $56.46 fib, $54.74 fib, $53.32 monthly MSL trigger and the $51.86 fib. The upside reversion levels sit at the $61.29 weekly MSH up to $69.04 weekly upper BBs and fib and the $73.43 monthly upper BB. AMAT shares have positive correlation with peers KLAC and LRCX, so monitor all three is trading.
