Get 40% Off
⚠ Earnings Alert! Which stocks are poised to surge?
See the stocks on our ProPicks radar. These strategies gained 19.7% year-to-date.
Unlock full list

Apple Sellers' Target And Buyers' Hope

Published 01/31/2016, 06:24 PM
Updated 07/09/2023, 06:31 AM

Sellers Downside Target

Apple Weekly Chart

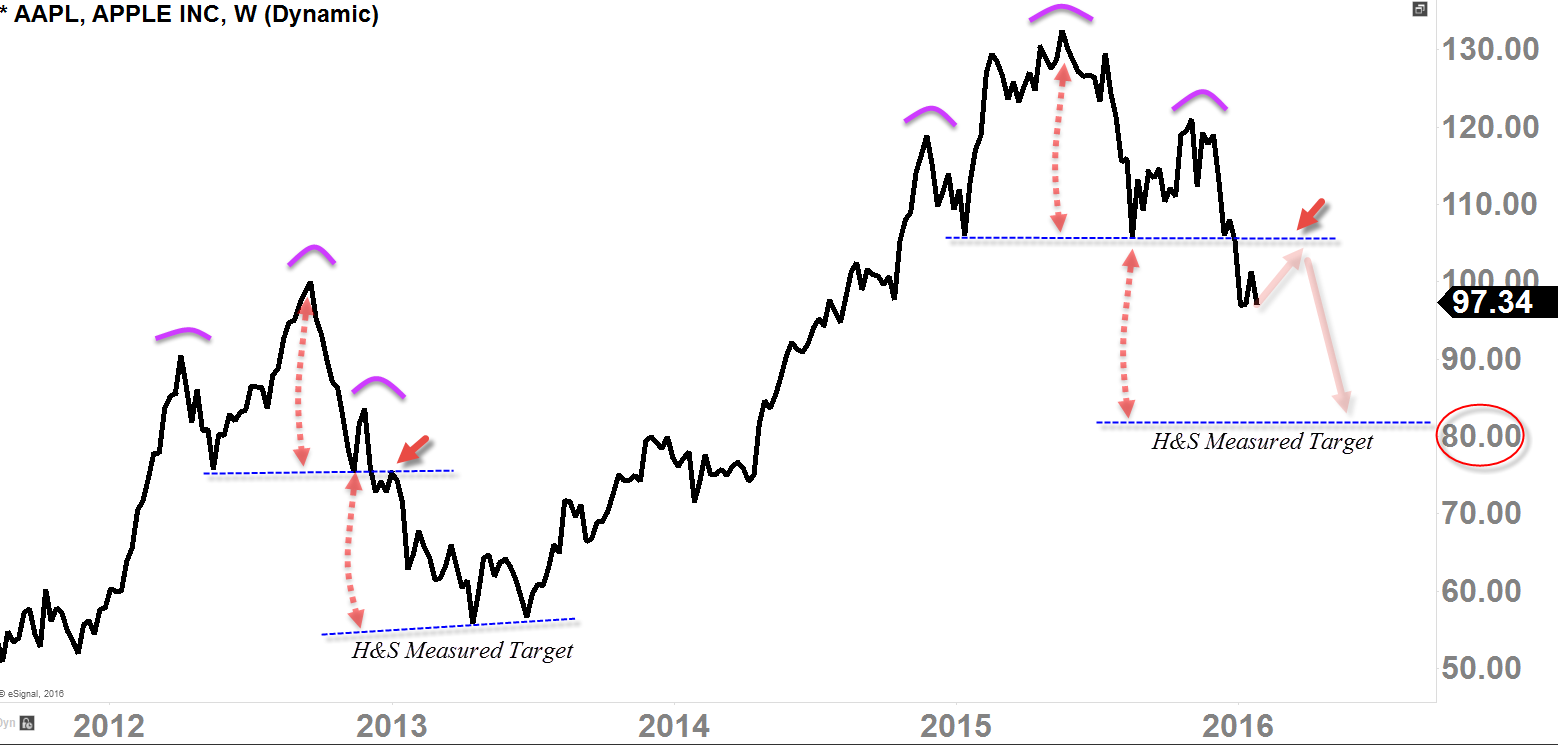
  • Early-2013, H&S pattern was "confirmed" once it has retested the "neckline" (see arrow) resistance and got rejected
  • Once the "neckline" was rejected, sellers rushed in, bring it down to the H&S Measured Target
  • Today, we have broken below the "neckline", which means, next step (for the sellers) is to retest the neckline (see arrow)
  • If we get rejected at the "neckline", like 2013, we may see sellers rush in to bring it down to the H&S Measure Target at $80ish.

Buyer's Hope

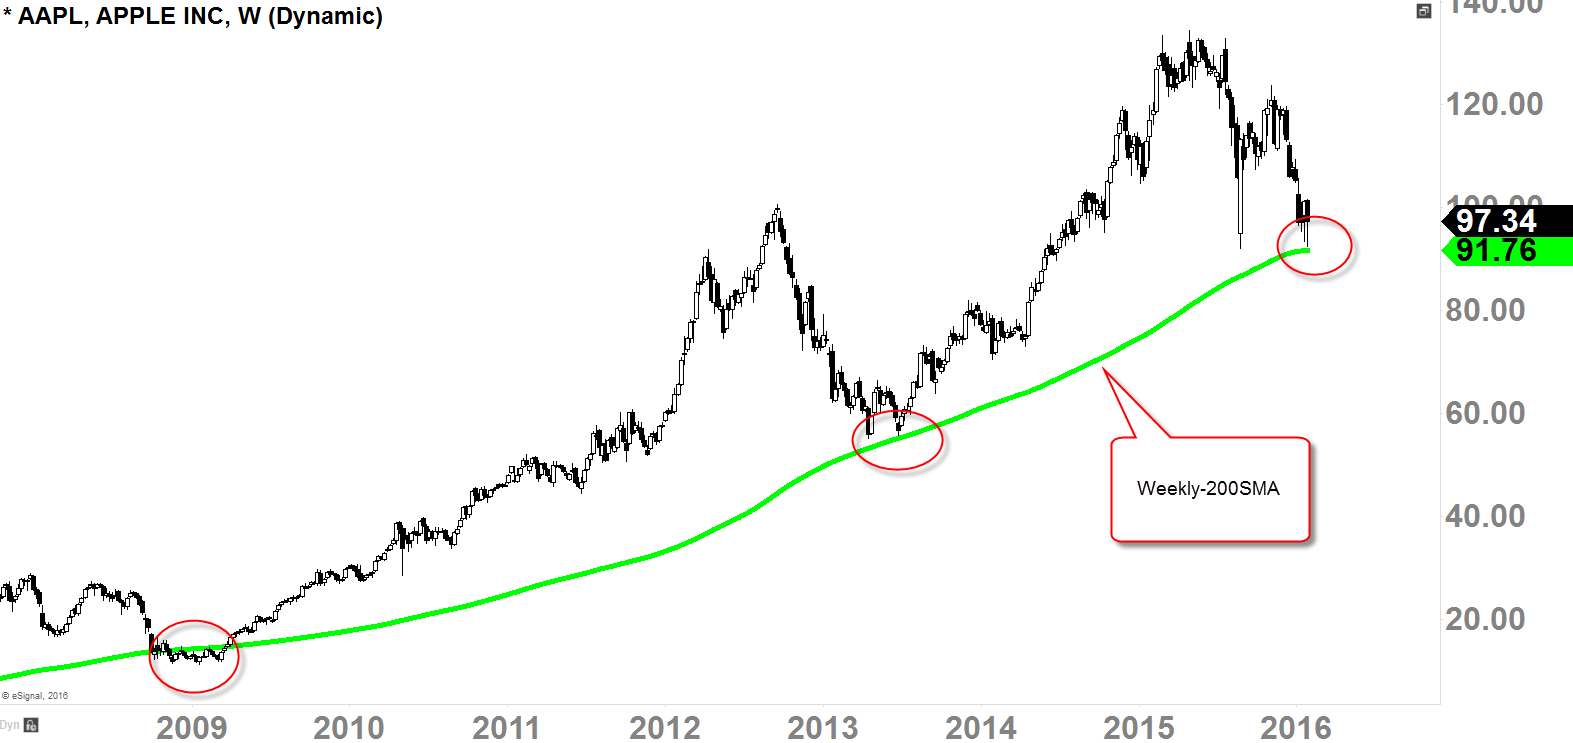
Apple Weekly Chart with 200SMA

  • Weekly-200SMA (Simple Moving Average) has been served as the savior for Apple (O:AAPL) in 2009 and late-2013
  • Today, we are sitting right on this moving average
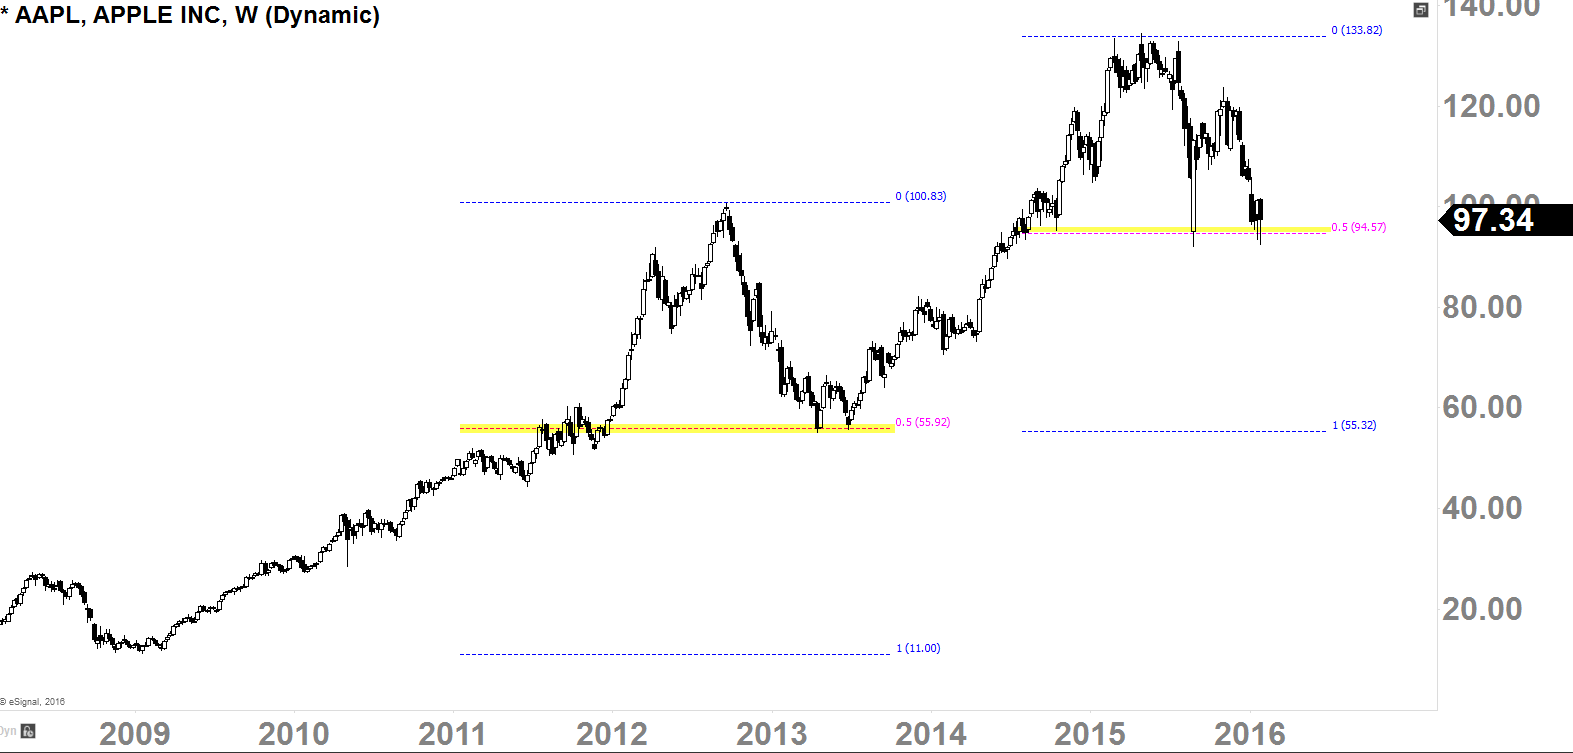
Apple Weekly Chart with Fibonacci Retracement

  • Fibonacci 50% Retracement (measuring from 2009-low to the 2012-high) level was the level where Apple bottomed back in late-2013
  • Today, Fibonacci 50% Retracement (measuring from 2013-low to the 2015-high) is where we are sitting on
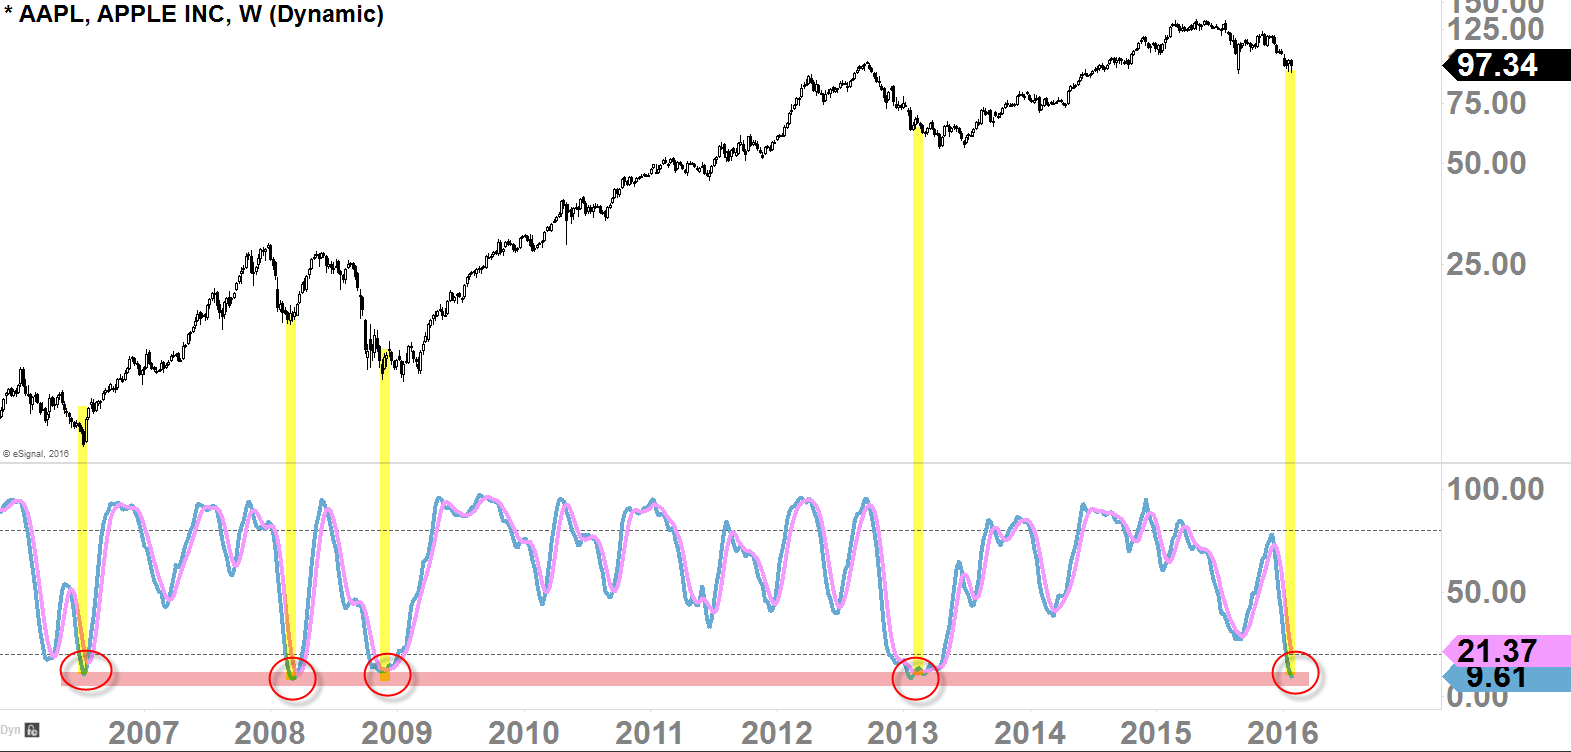
Apple Weekly Chart (Log Scale) with Stochastics

  • Late-2016, 2008, 2009, and 2013; weekly-Stochastics insinuated the bounce was coming as the Stochastics was at the "overbought" level
  • Today, we are back at the "overbought" level
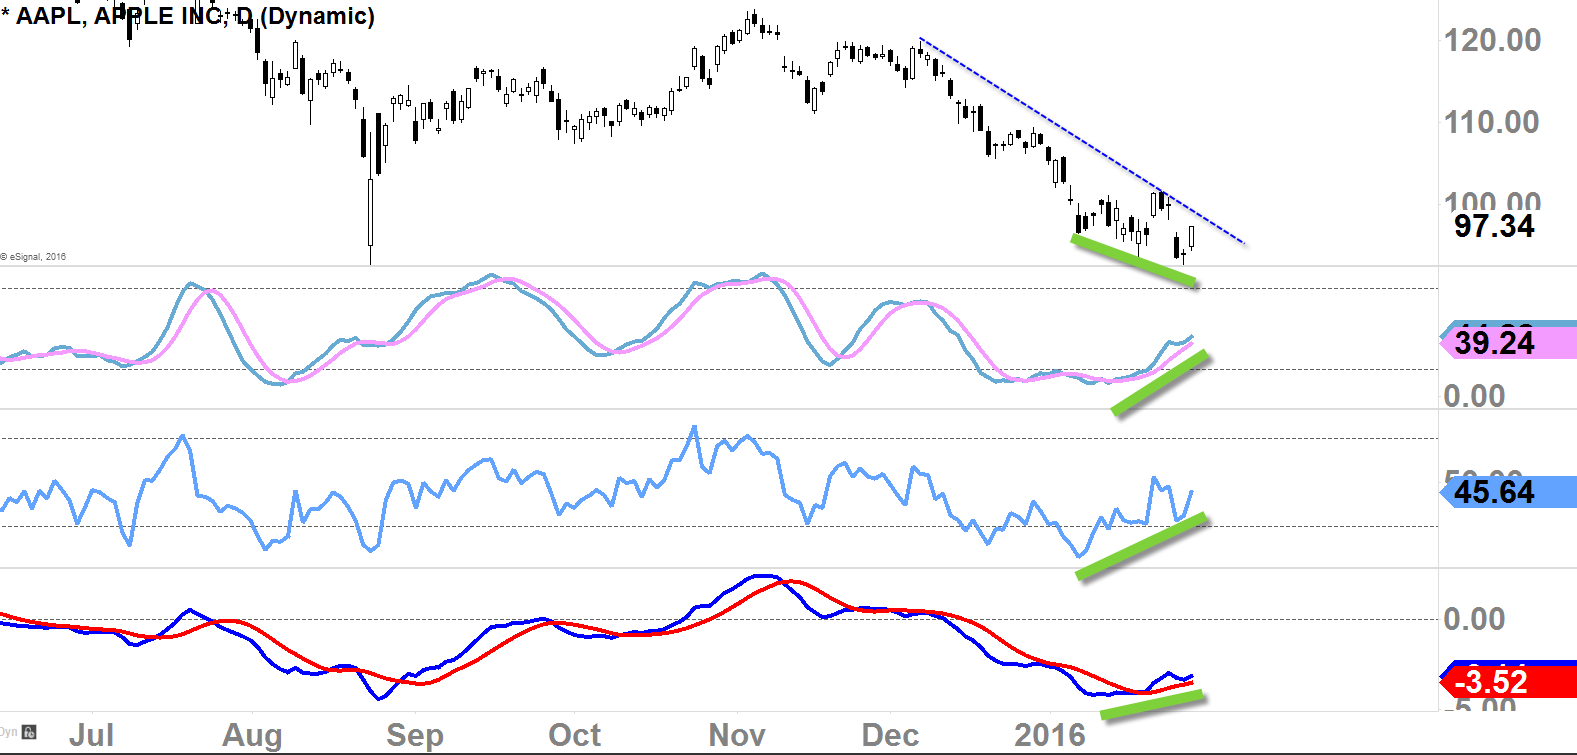
Apple Daily Chart with the Oscillators (Stoch, RSI, MACD)

  • Minor-term bullish divergence has been formed
  • Price-action needs to stay well above $103 to be "confirmed"

How to Nullify the H&S Pattern
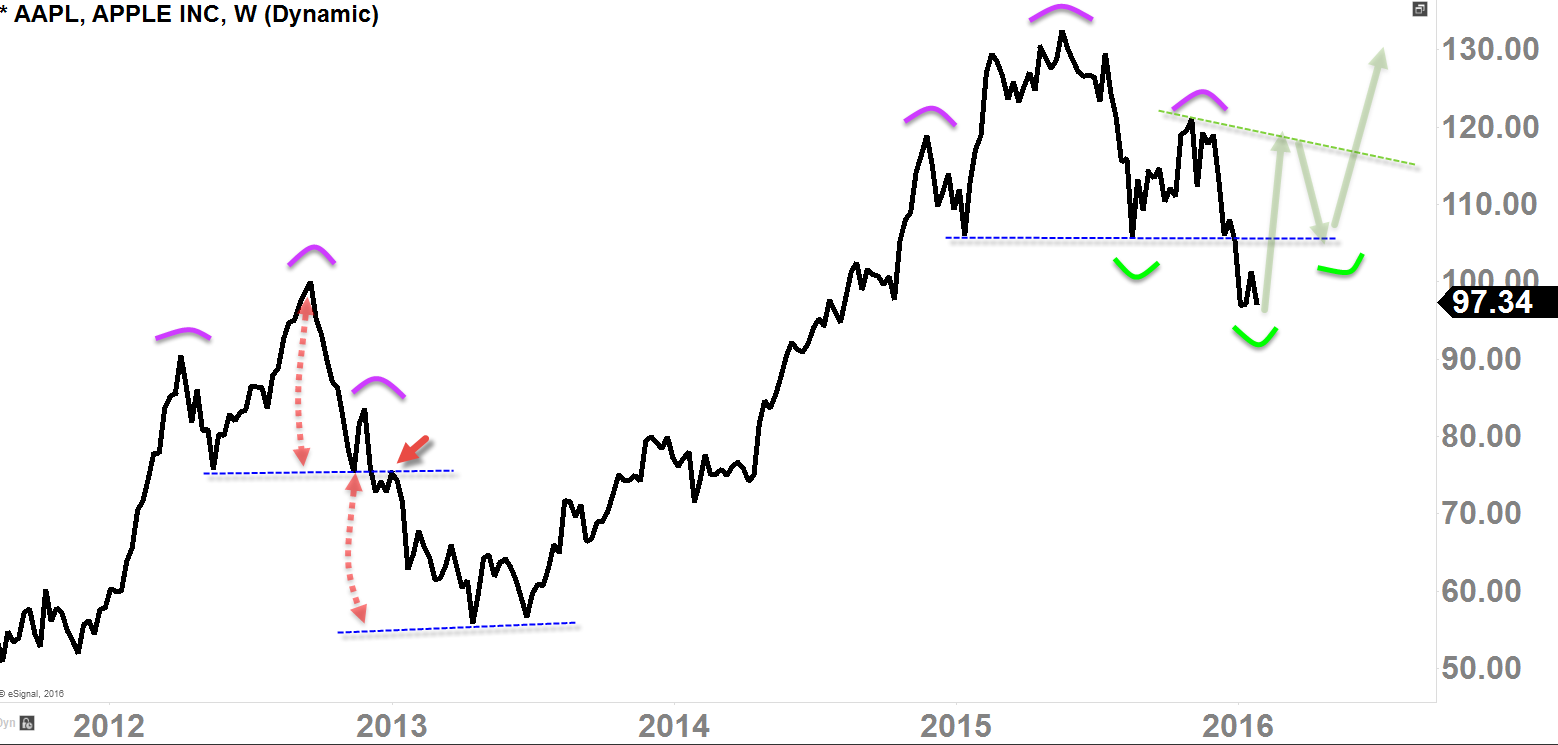
Apple Weekly Line Chart

It doesn't always happen, but sometimes (actually more often than we perceived as) H&S pattern can be nullified; if you go back and study the historical charts,

it actually happens quite often. So if the buyers want to see no further selling from this point on, the price must shoot-up to about $112-$115 level for this to work.

Once we get there, pullback will come, and this is where it's very important, when the pullback occurs, the price-action must print intermediate-term "higher-low" thus creating that "right shoulder" on this Inverted Head & Shoulder scenario I've drawn.

If the "right shoulder" has been created, now the Inverted H&S "neckline" must be reclaimed to the upside; and if we can do that by thrusting above the Inverted H&S neckline, I would have to say that's when the Apple has been completely reversed to the upside.

This process could take up to 2-4 months, if, indeed, it's happening this way.

Final Thoughts


Current H&S formation is deadly and dangerous for Apple.

If or when it gets fully confirmed, around $80 is probably where its headed (possibly even lower); especially, with the overall market inflicting extreme-fear upon the investors/traders,

it is not helping this stock. However, I did want to point out, that we are sitting on the last level of support if the buyers decide to make something happen. It's also interesting to note that many of the market-indices are sitting on the last level as well.

Buyers are just barely grasping for air before much more selling occurs for sure; but if the buyers are going to turn things around before we get to the $80, now is the time for the attempt.

Latest comments


It is hard to admit, but Current H&S formation is nearly deadly and dangerous for Apple. Some experts are insisting that it will get fully confirmed at the nearest future and headed probably around $80 or possibly even lower, and especially, with the overall market inflicting extreme-fear upon the investors. But, we are sitting on the last level of support if the buyers decide to make something happen. And do you know what is the most exiting part? Many of the market-indices are sitting on the last level as well, that's the point. .
Hi August, yea I think we are currently seeing the oversold bounce on the market-indices, and yes, as you've mentioned, even the indices are also sitting on the last level as well (http://www.investing.com/analysis/bulls'-one-last-fight:-in-depth-technical-analysis-382387). . $94 is the last level for AAPL, if we lose this level, we probably going down $80 or lower. If the buyers want to see the hope of reversal to the upside, $110 is the level to overcome..
Risk Disclosure: Trading in financial instruments and/or cryptocurrencies involves high risks including the risk of losing some, or all, of your investment amount, and may not be suitable for all investors. Prices of cryptocurrencies are extremely volatile and may be affected by external factors such as financial, regulatory or political events. Trading on margin increases the financial risks.
Before deciding to trade in financial instrument or cryptocurrencies you should be fully informed of the risks and costs associated with trading the financial markets, carefully consider your investment objectives, level of experience, and risk appetite, and seek professional advice where needed.
Fusion Media would like to remind you that the data contained in this website is not necessarily real-time nor accurate. The data and prices on the website are not necessarily provided by any market or exchange, but may be provided by market makers, and so prices may not be accurate and may differ from the actual price at any given market, meaning prices are indicative and not appropriate for trading purposes. Fusion Media and any provider of the data contained in this website will not accept liability for any loss or damage as a result of your trading, or your reliance on the information contained within this website.
It is prohibited to use, store, reproduce, display, modify, transmit or distribute the data contained in this website without the explicit prior written permission of Fusion Media and/or the data provider. All intellectual property rights are reserved by the providers and/or the exchange providing the data contained in this website.
Fusion Media may be compensated by the advertisers that appear on the website, based on your interaction with the advertisements or advertisers.
© 2007-2024 - Fusion Media Limited. All Rights Reserved.