Get 40% Off
👀 👁 🧿 All eyes on Biogen, up +4,56% after posting earnings. Our AI picked it in March 2024.
Which stocks will surge next?
Unlock AI-picked Stocks

Apple: Low $100s Next?

Published 05/06/2021, 01:56 AM
Updated 07/09/2023, 06:31 AM

It has been almost a month since I last provided an update on Apple (NASDAQ:AAPL). It was trading at $132s back then using the Elliott Wave Principle I found:

"Given the current rally's strength, with all the technical indicators pointing up and on a buy, more upside … seems most likely. Thus the $133-138 zone should get reached. … I will watch how price reacts in the $133-138 zone if there will be overlap with $127 from there, and, if so, look towards the $110+/-5 zone (red wave-c) for wave-4 before wave-5 commences (red dotted arrows)."

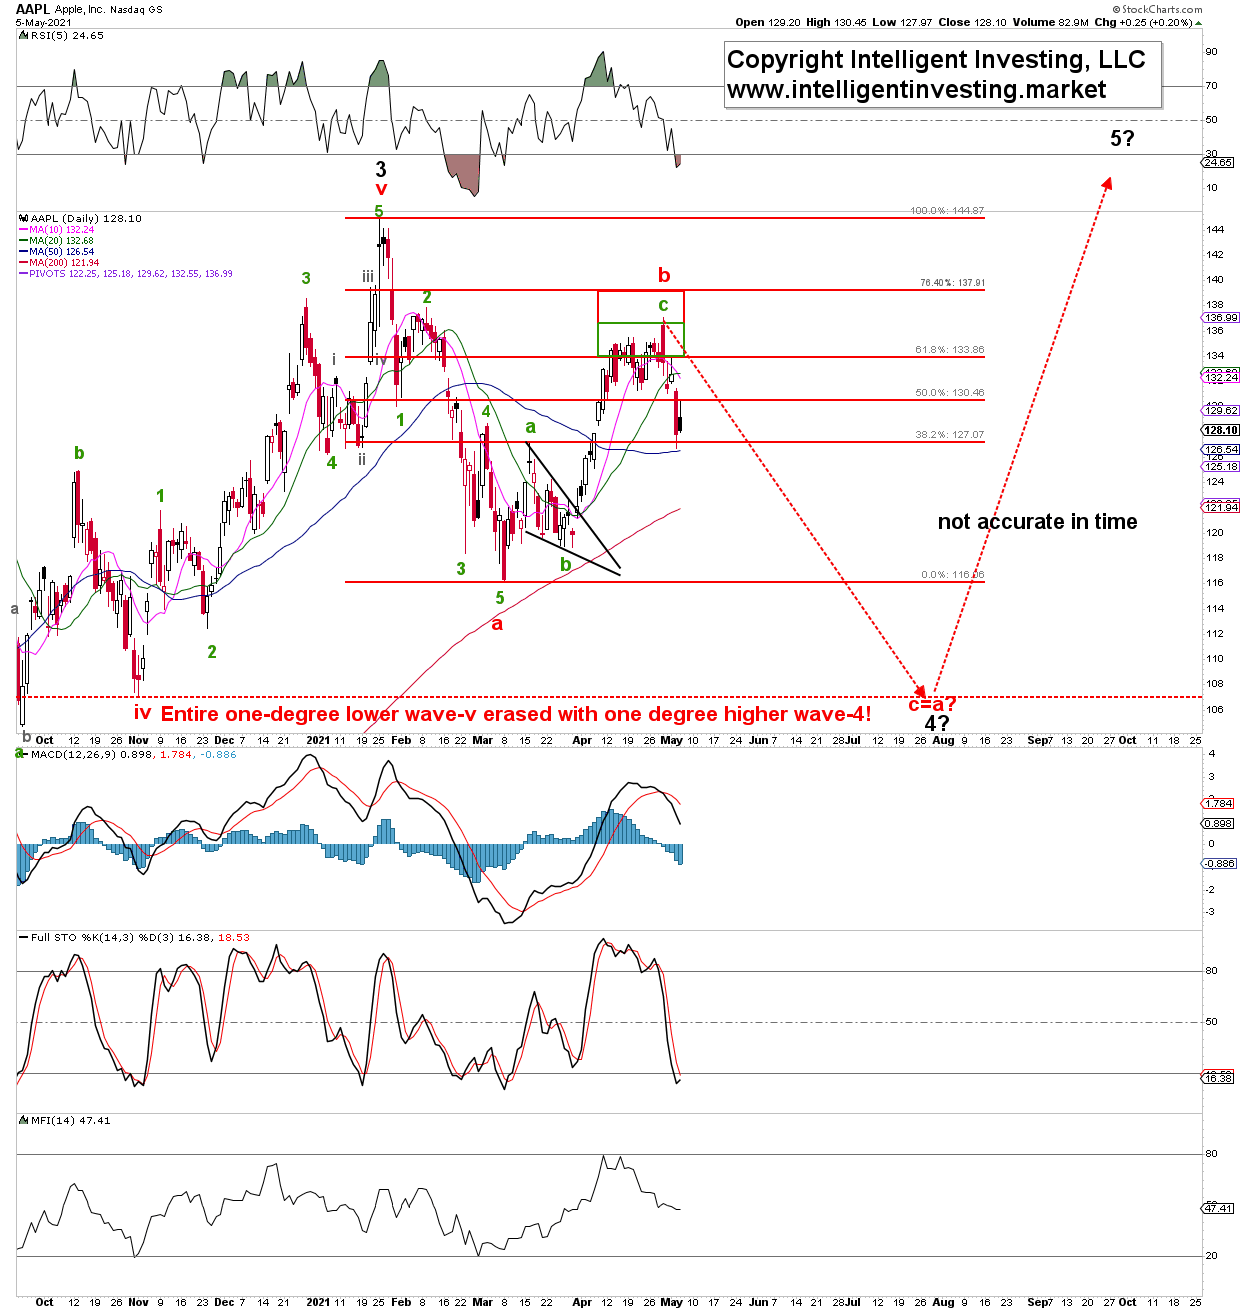
Last week AAPL reached as high as $137 on earnings, right in the ideal target zones (see Figure 1 below), but yesterday it traded as low as $126.75. An 8% decline so far, while earnings were stellar. Hence. not the reaction many may have anticipated, but my preferred EWP count did.

Thus, the price overlapped with the Mar. 16, $127.22 high. This overlap means the current decline cannot be a fourth wave anymore because, in an impulse, fourth waves' lows and first waves' highs are not allowed to overlap. Only in diagonals, but those are unreliable price structures. Hence, my preferred view has been correct over the last two months, and AAPL should now be in the (red) c-wave lower: see Figure 1 below.

Figure 1: AAPL daily candlestick chart with technical indicators and preferred Elliott Wave count
Apple Inc Daily Chart

A simple (red) c=a relationship targets $107, right at the lateOctober 2020 low. That low was a one-degree lower fourth wave (intermediate-iv), whereas IMHO, AAPL is now most likely in (black) major-4. Fourth waves often retrace the entire prior one-degree lower fifth wave, in this case, intermediate-v of Major-3. The next hurdle is for AAPL to take out the 50-day Simple Moving Average (SMA), followed by the 200d SMA.

3rd party Ad. Not an offer or recommendation by Investing.com. See disclosure here or remove ads .

When those hurdles clear, $110+/-5, as I already suggested it would reach early March (see here), should be in reach and become an attractive buying opportunity as I anticipate AAPL to rally to new all-time highs from there; think $165-195. A low risk (~$15) - high reward ($60+) trade because if AAPL moves below $105 on a weekly closing basis, then $90 is next.AAPL will have to move above last week's high from around current levels to discredit my present intermediate-term Bearish EWP-based thesis.

Latest comments

proving accurate so far...115 was low (your target of 110+/-5), and now has sights around 180.
I started to follow you as there are not many EW users out there, I only use EW and have been trading for 3 1/2 yrs using EW and some indicators like AO, ParSar and MA cross. Question, Are you calling the bullish trend green waves and the bearish trend red waves? Looking forward to your articles...Thanks.
Thank you! Color destinction may also relate to wave degree.
thoughts on sp500?
LOL
Risk Disclosure: Trading in financial instruments and/or cryptocurrencies involves high risks including the risk of losing some, or all, of your investment amount, and may not be suitable for all investors. Prices of cryptocurrencies are extremely volatile and may be affected by external factors such as financial, regulatory or political events. Trading on margin increases the financial risks.
Before deciding to trade in financial instrument or cryptocurrencies you should be fully informed of the risks and costs associated with trading the financial markets, carefully consider your investment objectives, level of experience, and risk appetite, and seek professional advice where needed.
Fusion Media would like to remind you that the data contained in this website is not necessarily real-time nor accurate. The data and prices on the website are not necessarily provided by any market or exchange, but may be provided by market makers, and so prices may not be accurate and may differ from the actual price at any given market, meaning prices are indicative and not appropriate for trading purposes. Fusion Media and any provider of the data contained in this website will not accept liability for any loss or damage as a result of your trading, or your reliance on the information contained within this website.
It is prohibited to use, store, reproduce, display, modify, transmit or distribute the data contained in this website without the explicit prior written permission of Fusion Media and/or the data provider. All intellectual property rights are reserved by the providers and/or the exchange providing the data contained in this website.
Fusion Media may be compensated by the advertisers that appear on the website, based on your interaction with the advertisements or advertisers.
© 2007-2024 - Fusion Media Limited. All Rights Reserved.