
Minor-Term Sentiment
Apple (O:AAPL) has actually been lagging under the selling-pressure since the late-August and recently with the anticipation of the Earnings Report.
Once it breached above the resistance-level (blue dotted-line), buyers were able to bring it back up to the resistance from the August 10th high (pink), pulled back for few days after that anticipating the Earnings Report, but now we are seeing two days of follow-through after positive Earnings reaction.
The current sentiment shows that the buyers are gaining confidence and control coming out of the 'fear' level they were in just few months ago. $120-level has been the level we've been looking at since the sell-off event occurred in August. With today's bullish move, we are now trading above this level, and it's important that we stay above $120-level tomorrow (10/30 Friday) so that the buyers can continue with the momentum next week.
- Current price-action movement favors the buyers in the minor-term as long as it stays above $120-level

Intermediate-Term Sentiment
Weekly-100SMA has been acting as strong pivot (see arrows) since the late-2012's crash.
In early-2014, it started to support the buyers, and sure enough, even with the recent decline, it acted as strong support as you can see the long-bullish candle right on it. Weekly-MACD has now crossed back up giving us the "buy" signal, which is the first thing you want to look for if you are looking for the uptrend development.
- This is a great signal for the buyers that could ignite/resume the uptrend which could last for 8-12 months

Primary-Term Sentiment
Looking at the chart below, we can identify that the primary-term uptrend is still valid and in the process of resuming while the RSI is fully supporting this idea.
RSI hit the bottom of the band ("oversold" status) only three times since the 2009 (see red circles). 2013 was the second time we've seen RSI to reside there for a moment before bouncing back up, and just few months back RSI once again hit the "oversold" level and now fully expanding to the upside.
This signal can be nullified with without the price-action supporting it, but as you can see price-action is also expanding to the upside confirming the signal from the RSI.
- Weekly-RSI is indicating that the primary-term uptrend is ready to resume to the upside

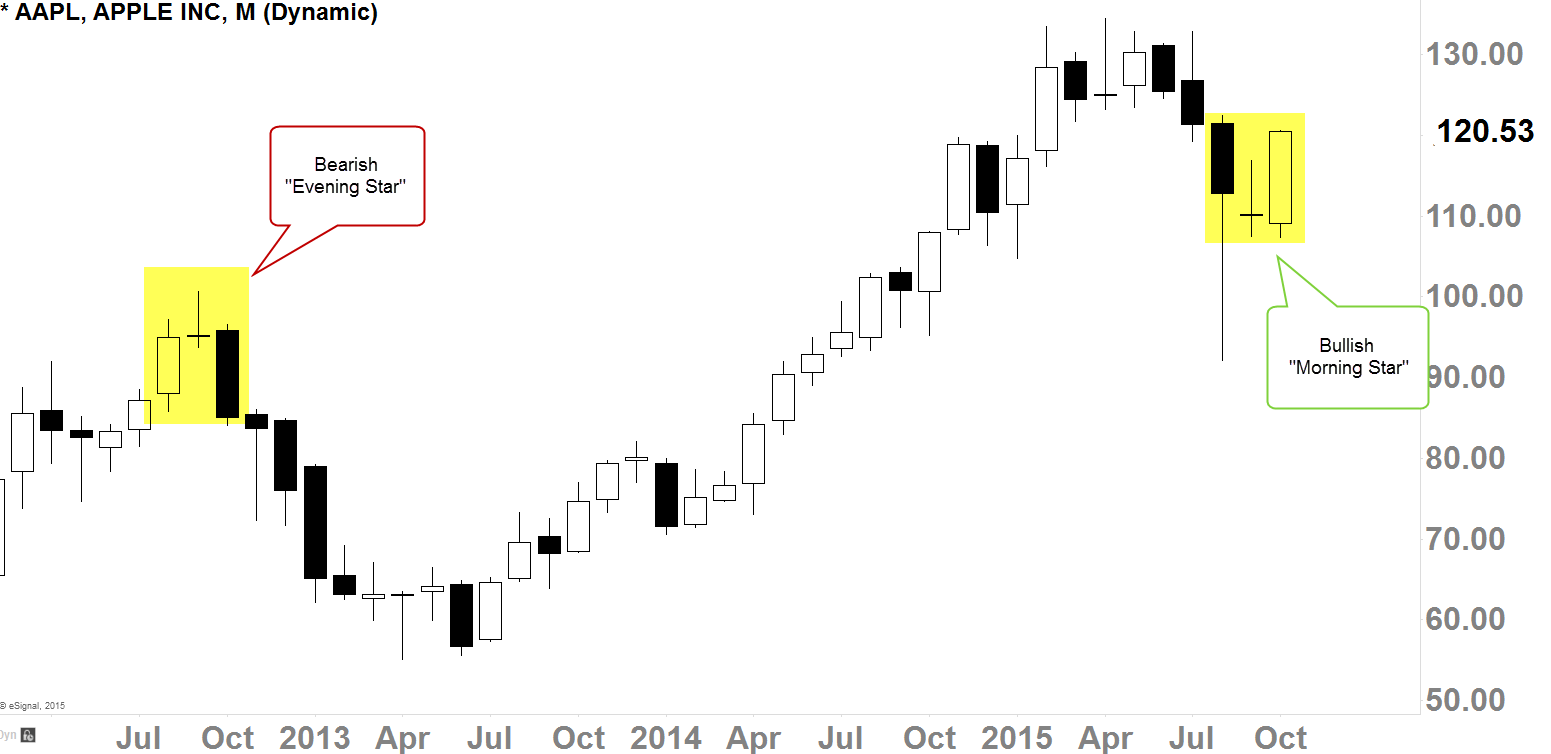
Candle Analysis
It's important that when we do a candle analysis, we must understand that the certain patterns must be confirmed.
Take a look at the "Bearish Evening Star" formation back in late-2012, when the follow-through action (closing below the previous candle) occurred on the following month, that's when the selling pressure really started to increase for the next 4-5 months.
Today, we are seeing a "Bullish Morning Star" formation, but it won't be confirmed until we see a follow-through to the upside by the end of November.
- Nevertheless, it's a positive signal for the bulls because of other signals/indications we've discussed so far in this post--more evidence
Target Price
When it comes to the target analysis, it takes several methods to accurately pin point the designated price-level, but in this article, I would like to show you one of the methods using Fibonacci Extension tool.
First of all, as you can see that the price is now well-above the Fibonacci Retracement Zone (FRZ - highlighted), that's also a signal for bullish sentiment. FRZ is used to identify next LOWER-HIGH level (before the inauguration/development of a downtrend), so when the price-action thrust above the FRZ, it means the bulls are getting away from the possibility of developing a downtrend.
There is a huge gap-area in $130 to $126ish level, that's the level where things could get hectic for the buyers; it means we may see some volatility in that vicinity, and it may take sometime to get above that level. If we can able to breach well-above that gap-area, I do believe the move might be smooth to the upside.
- 138.2% Fibonacci Extension is used for the next target-price of $150.00
