Earnings Preview
Darden Restaurants (NYSE:DRI) is expected to report earnings on Tuesday before the market opens. While shareholders have enjoyed a 12% increase over the last twelve months, shares still appear undervalued on a fundamental basis.
The company’s shares last traded at $76.62 as of Thursday, approximately 97% of its all-time high. This is partially due to Darden’s stellar performance over the last several quarters. According to Zacks Investment Research, this casual dining restaurant chain has beaten earnings estimates on an average of 2.6% over the last four quarters.
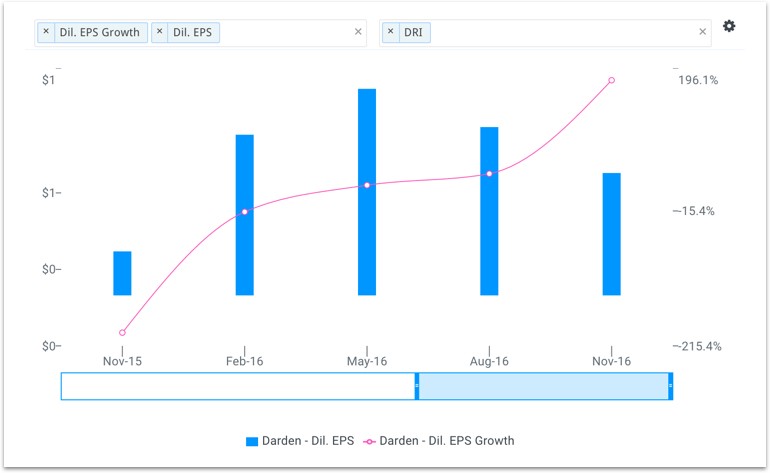
The chart below highlights Darden’s impressive earnings per share (EPS) growth YoY over the previous five quarters.
Expect Another Impressive Quarter
The Olive Garden brand currently represents approximately 50% of total company revenue and nearly 60% of total EBITDA. This Italian-American cuisine chain is currently implementing a set of initiatives that will help grow its top and bottom line. These initiatives include remodeling its restaurants and developing new menu items for health conscious consumers while simplifying kitchen systems. The launch of Olive Garden’s to-go business in addition to its tablet rollout is expected to improve overall customer satisfaction.
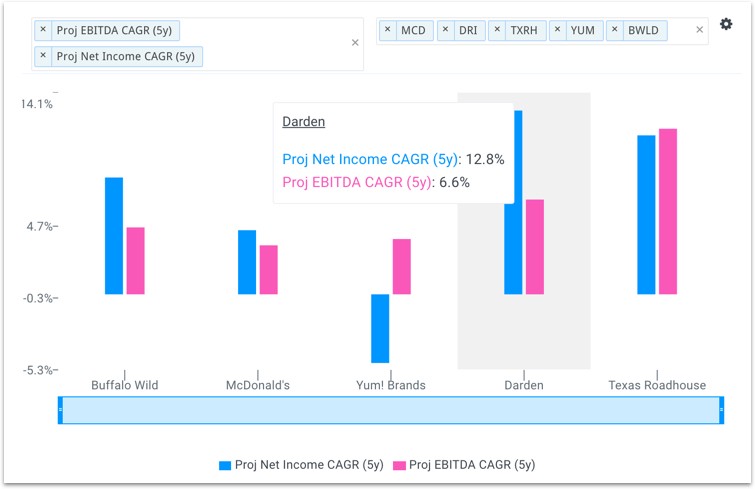
These initiatives help explain why Wall Street expects Darden’s EBITDA and earnings to grow at a higher rate than its peers over the next five years as illustrated in the chart below. Overall, the company’s growth looks attractive when compared to a few of its publicly traded peers: Buffalo Wild Wings (NASDAQ:BWLD), McDonald’s (NYSE:MCD), Yum! Brands (NYSE:YUM) and Texas Roadhouse (NASDAQ:TXRH).
Valuation Looks Attractive
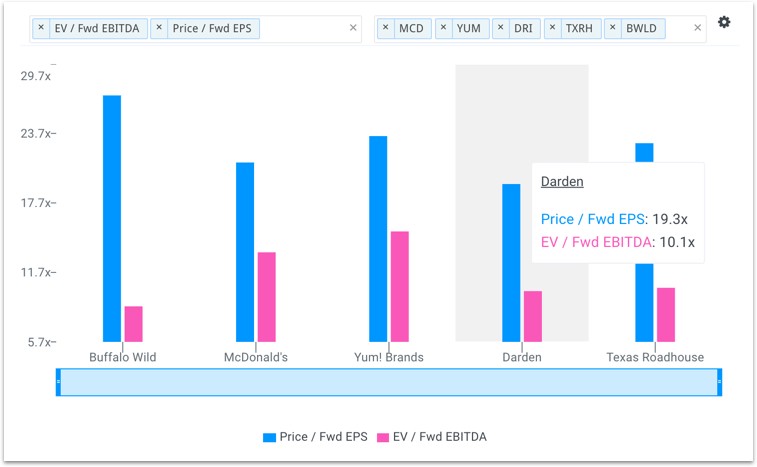
Typically, higher growth stocks will trade at higher multiples of earnings but this doesn’t appear to be the case for Darden. The company’s forward EBITDA multiple of 10.1x is only above BWLD (8.8x) and below MCD (13.4x), YUM (15.2x) and TXRH (10.4x). Furthermore, Darden’s forward P/E multiple of 19.3x is below all of the comparable companies: BWLD (27.0x), MCD (21.2x), YUM (23.5x) and TXRH (22.8x).
Conclusion
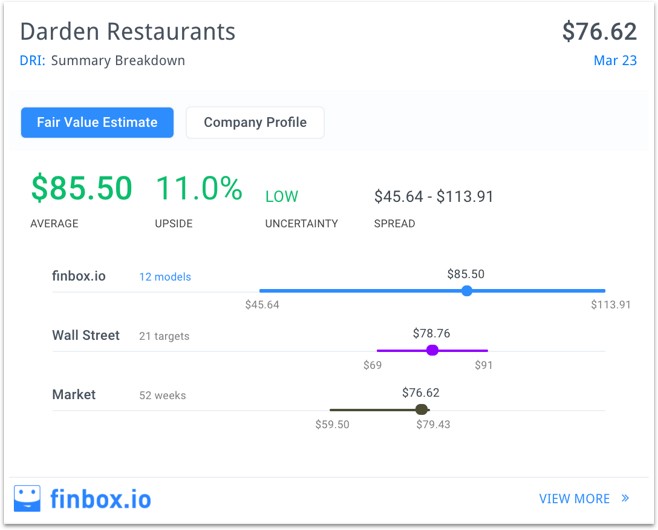
While the Darden is trading near its all-time high, the stock’s valuation still looks attractive at current levels. Finbox.io’s fair value data implies that the stock is 11% undervalued while Wall Street’s consensus price target of $78.76 also implies some upside.
View all 12 valuation models that derive Darden Restaurants’ fair value estimate.
The company has positively surprised on earnings day over the last several quarters as strategic initiatives continue to be rolled out. Don’t be surprised if this trend continues on Tuesday.
