The buying of US dollars or selling of the Oceanic currencies has been dominant through inter-market dealings this Monday, as the market's anxiety keeps rising following a dramatic increase in the cases of COVID-19 internationally, with Italy the last country to take extraordinary measures. Have we reached a 'watershed moment', as South Korea puts it? Find out all the latest in today's report.
Quick Take
The market is playing a ‘defensive’ card to start the week as COVID-19 anxiety continues on the rise as the international cases and deaths keep spreading from North Korea, through Iran, all the way to Italy, where over 130 cases are now detected. This has led to extraordinary containment measures by governments to slow down the spreading of cases, while the G20 group, in its weekend meet-up, pledges to be ready to step up to the plate with coordinated fiscal stimulus, stating that it sees heightened “prospects of further downside risk to global growth persisting as the coronavirus raises uncertainty and disrupts supply chains.”
Some authorities in the space of virology, via Twitter, are concluding that while it has taken a while for the spread to take off, we are finally seeing it come to life now. Note, The international spread of the virus means that monitoring of the COVID-19 stats outside China will serve as a more accurate representation of the true evolution of the virus. This, in m opinion, poses downside risks to further episodes of risk-off as these countries hit by the virus have far more robust processes of transparency to report the real situation as opposed to China, which as we know, has been criticized for downplaying the true magnitude of this tragedy.
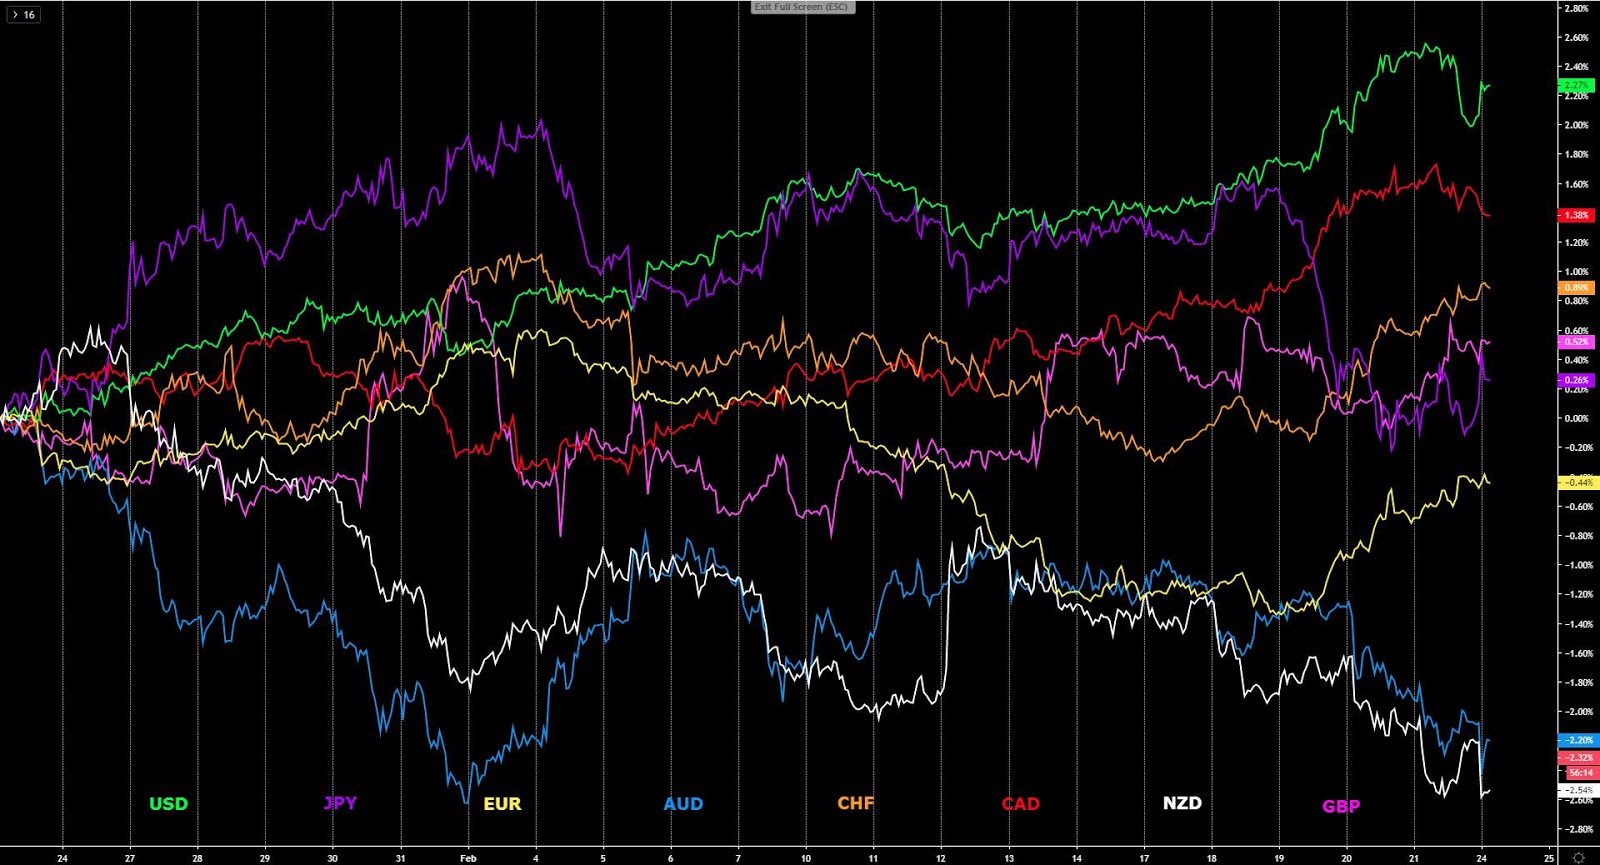
In the currency market, the usual suspects (AUD, NZD) gapped down significantly, while there was an important buying frenze towards the USD in inter-market dealings. The Swissy maintains its status as the safe-haven of choice in recent days, especially after the Yen debacle, while the latter appears to now find more buying interest after reaching a huge resistance in USD/JPY above 112.00, a juncture I suspected in my last technical outlook to be a key inflection point.
Meanwhile, the Euro has seen a positive shift in order flow, and unlike the previous recoveries, this one really looks like it carries more substance judging by the market structure break and most importantly, where it has occurred in the weekly chart (all details in the chart insights). The Canadian Dollar, which has been trading super impressively alongside the USD as it attracted capital flows away from a panic-stricken Asian continent, is easing a bit, but still remains one of the favorites destinations to park one’s money. Lastly, the currency most unaffected by the COVID-19 pendulum remains the Pound, firming up in the last 24h.
Narratives In Financial Markets
* The Information is gathered after scanning top publications including the FT, WSJ, Reuters, Bloomberg, ForexLive, Twitter, Institutional Bank Research reports.
COVID-19 anxiety on the rise: The sense of fear about a new phase of the COVID-19 spreading internationally is reigning in the markets, which sold off aggressively on Friday as more cases and deaths are reported. Kai Kupferschmidt, Science journalist and molecular biologist at Science Magazine, and a must-follow in Twitter on all things COVID-19 related, warned that “the last few days have felt like a profound shift in the epidemic as we are clearly entering a new phase.” Kai’s thread is an eye-opener for those that want to understand the high uncertainty that exists as the market fears the global slowdown may be more severe than thought.
International cases up: News over the weekend has depressed sentiment further with important gaps in the currencies most sensitive to risk such as the Aussie, Kiwi, Yen, USD. The number of cases has ballooned to over 600 in South Korea and more than 100 in Italy, resulting in officials taking extraordinary containment measures to slow down the spreading of cases. The accepted truth is that the international monitoring of the COVID-19 stats will serve as a more accurate representation of the true evolution of the virus as these are countries where there are more robust processes of transparency to report the real situation as opposed to China.
WHO's daily update on the COVID-19 situation: Cases outside China rose to 1769 (+367), which in words of Helen Branswell, Senior Writer in infectious diseases for @statnews, and another must follow in Twitter to get fed with objectivity, “is a sharp increase in recent days as there are now 17 (+6) deaths outside China.” Helen notes that only 1 month ago, there were 11 known cases outside China, hence throwing the following conclusion, “it takes a while for the spread to take off and we are seeing it now.”
US 30-year bond yield at all-time low: One of the most accurate indicators followed by the smart money to gauge the real concerns towards growth globally is the US 30 year bond yield as it acts as the preferred barometer to analyze these prospects. On Friday, it printed the lowest level on record by marginally breaking sub 1.9%. This is a clear declaration of intention by bond vigilantes that the COVID-19 induced suppressed global growth prospects this year is going to wreak havoc inflation expectations and lead to easier policies.
Equities dumped as complacency over: US equities, which have been highly complacent to the COVID-19 related impact on the valuation of stocks amid the bleak background, were also dumped. The S&P500 was down by over 1% and the Nasdaq index fell sharper by 1.8%. In Europe, the Stoxx Europe 600 Index fell 0.5%, with the exception being China as the Shanghai composite gained 4%+ for the week. The performance in yields and equities continues to be music to the ears of gold bulls.
Short US equities, long gold trade of the century? Crescat, one of the top hedge funds by performance in 2019, made a presentation last week, noting that equities in the US is the greatest speculative mania seen and thus shorting stocks could be one of the trades of the century. Watch the video presentation here. These are the same guys, with Tavi Costa, global macro analyst at Crescat Capital, one of the big voices, that were promoting the bullish trade idea on precious metals last year, explaining in detail in this video why it was finally time for gold to start outperforming. That view was spot on.
G20 ready to step up to the plate: In response to the pick up in the COVID-19 activity outside and inside the Chinese borders, over the weekend, officials from numerous countries from the G20 group were cited suggesting that governments may have to step up to the plate through coordinated fiscal stimulus. The official statement raises the prospects of further downside risk to global growth persisting as the coronavirus raises uncertainty and disrupts supply chains. It is these headwinds that led them to state “agreed to be ready to intervene with the necessary policies related to risks.” For a summary of the key headlines you can check the portal Forexlive.
Sanders wins Nevada Caucus: Bernie Sanders won the Nevada caucus on Saturday with 46% of the vote vs 19.6% for Biden. The victories in these early Democratic primaries put him in a great position to end up being the Democrat nominee in the race to the Presidential elections against Trump later this year. All the attention now will shift to Super Tuesday on March 3rd with many states going to the polls.
US PMI disappoints: The IHS Markit Flash U.S. Composite PMI disappointed the market on Friday. The output contracted for the first time since October 2013. As part of the key findings, the flash U.S. Composite Output Index was 49.6 (53.3 in January), representing a 76-month low, while the Flash U.S. Services Business Activity Index was 49.4 (53.4 in January), again, a 76-month low. “The overall contraction was driven by a notable worsening of service sector performance, where output fell for the first time in four years”, the official report stated.
NZ retail sales slows a bit: New Zealand retail sales in Q4 exc inflation came a tad softer at 0.7% vs 0.8% estimate. In the prior quarter, the reading came in at 1.6%. For a full breakdown of the report, one can access the official report through the NZ Bureau of statistics, where it was noted that “electronics including appliances, mobile phones, and computers had the largest sales volume increase, while Supermarket and grocery stores had the second-largest fall.
Canadian retail sales showed no growth in December: Canada’s retail sales for December came at 0.0% vs 0.1% estimate. The data had little bearing in the price action of the Canadian Dollar to end the week. According to the official report, “higher sales at building material and garden equipment and supplies dealers, as well as food and beverage stores were more than offset by lower sales at motor vehicle and parts dealers and gasoline stations. Sales were up in 7 of 11 subsectors, representing 49% of retail trade.”
Japan faces a technical recession in Q1: Japan’s manufacturing PMI for February succumbed to its lowest level since 2014 after coming at 47.6 vs 48.8 previously while the service PMI sank into contraction too from 51 to 46.7. The official report cited Joe Hayes, Economist at IHS Markit, noting that the report “dashes any hopes of a first quarter recovery and raises the prospects of a technical recession.” In the wake of this report, BOJ governor Kuroda said that he “doesn't think another comprehensive review of monetary policy is needed”, even if “aware of IMF's view that BOJ should conduct one, even after having done so in 2016.” It’s become borderline ‘ridiculous’ to think that Japan will meet its 2% inflation target amid the fiscal, monetary, demographic and social mentality elements at play influencing the setting of prices in the country.
German PMI recovers but still early days: The only encouraging data came via the European PMIs, with better than expected readings out of Germany, at 47.8 vs 44.8 expected, or the Eurozone as a whole. However, by reading the comments by Phil Smith, Principal Economist at IHS Markit, it looks like this data still doesn’t fully represent what’s to come: “February’s ‘flash’ PMI results show that the German economy managed to eke out another marginal increase in business activity, despite a fresh setback to exports in the wake of the outbreak of the coronavirus. Reports from surveyed businesses indicate that, so far, disruption to manufacturing production from supply issues has been fairly limited, but these are still early days in what could potentially be a lengthy saga.”
Recent Economic Indicators & Events Ahead
Source: Forexfactory
Insights Into FX Majors
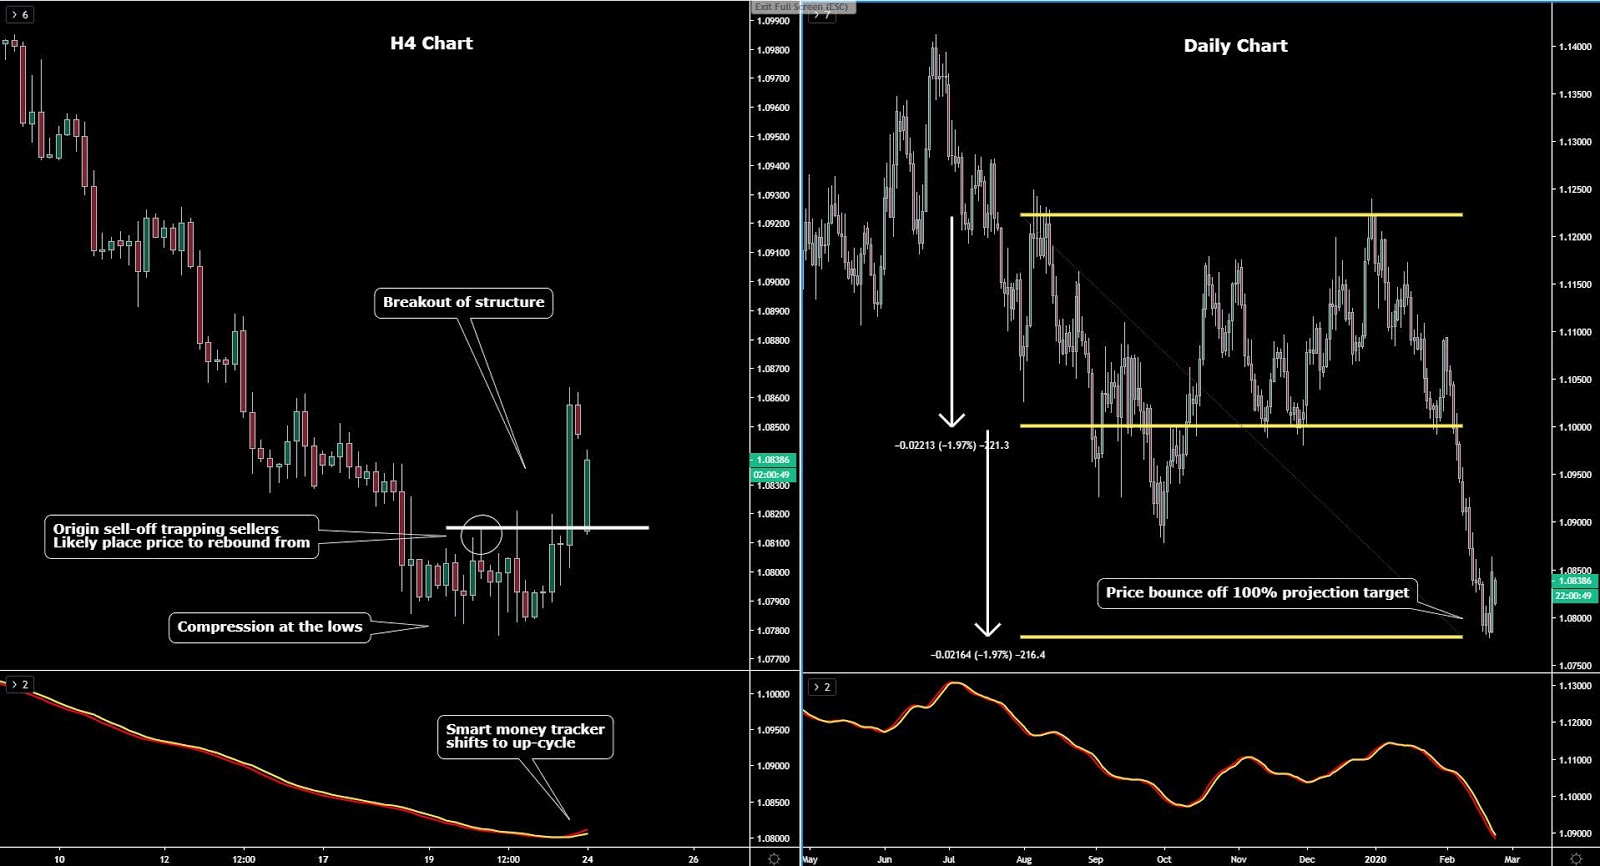
EUR/USD reached a 100% symmetrical target, an area susceptible to a shift in the order flow. One can read the footnotes in this report for further clarity on this topic. As one drills down into lower timeframes, we can observe that the pattern of compression into these lows (distribution - shorts closed) has finally led to a breakout of structure in favor of the buyers. I wouldn’ add much weight to this upside breakout given the steady sell-side flows, but considering it occurred at such a macro level in the chart (100% proj target off the weekly chart), there is a substance for the onset of a buying cycle.
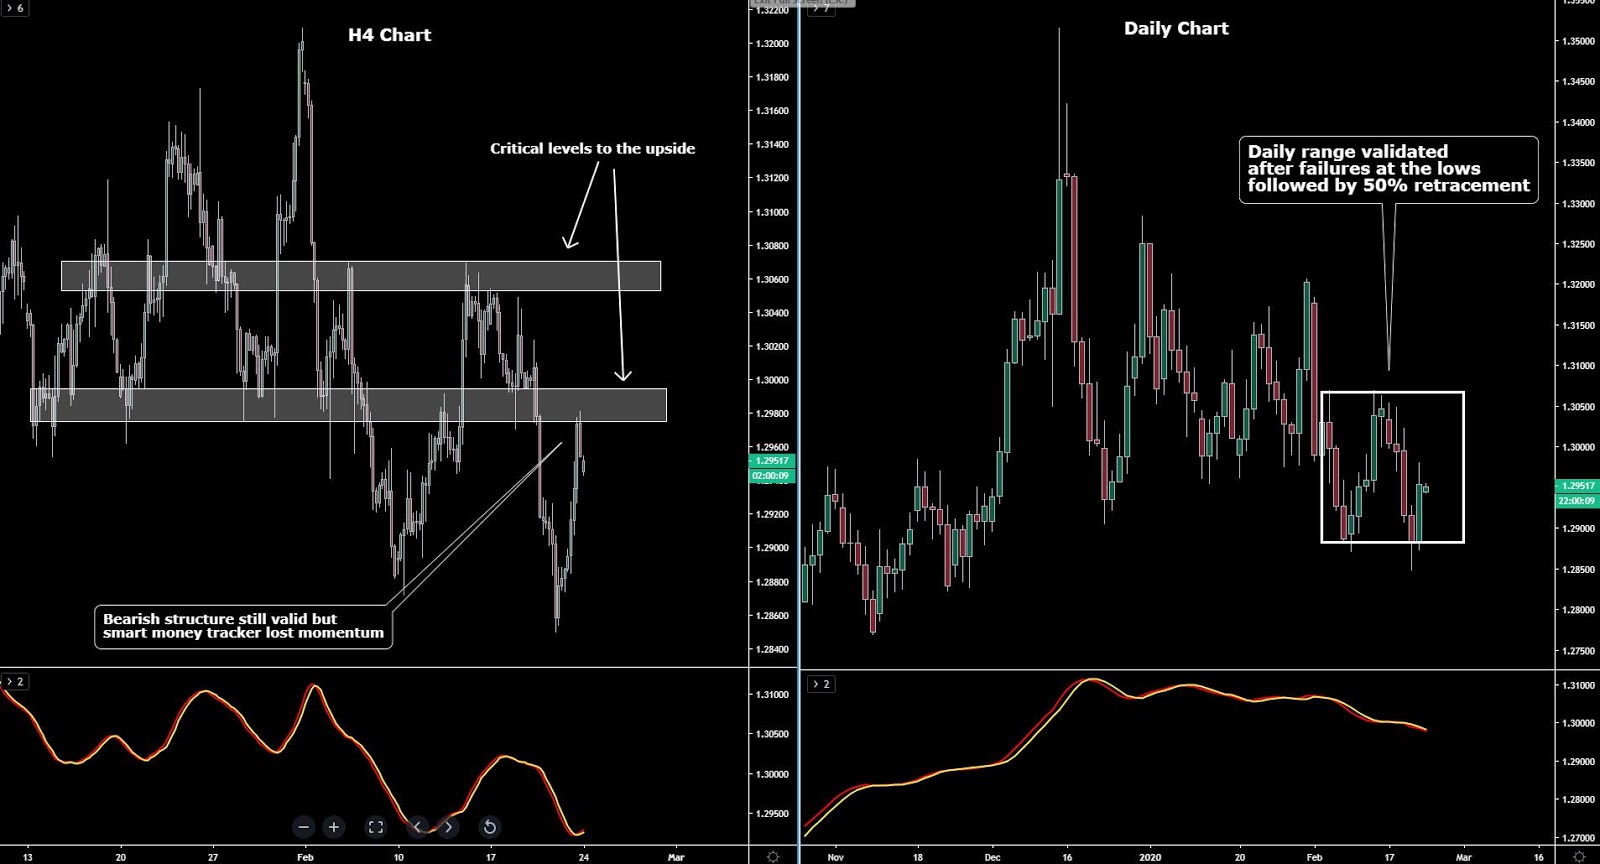
GBP/USD, one of the risks that faced on Friday was that the false breakout of the prior lows did evolve into the establishment of a daily range. That’s exactly what’s transpired by looking at how much the price has retraced. This means that the directional bearish bias off the daily gets invalidated until a clean breakout of the recent lows. On the H4, the structure remains bearish, but with the loss of momentum confirmed via the smart money tracker, this market is not as clear cut to be sold as it was during the late stages of last week. I’ve marked in white areas the key fighting grounds between buyers and sellers going forward. Until buyers don’t find acceptance above the immediate resistance, the upper hand is still for sellers structurally wise, even if as I said, you also want to see the momentum reversing to bearish.
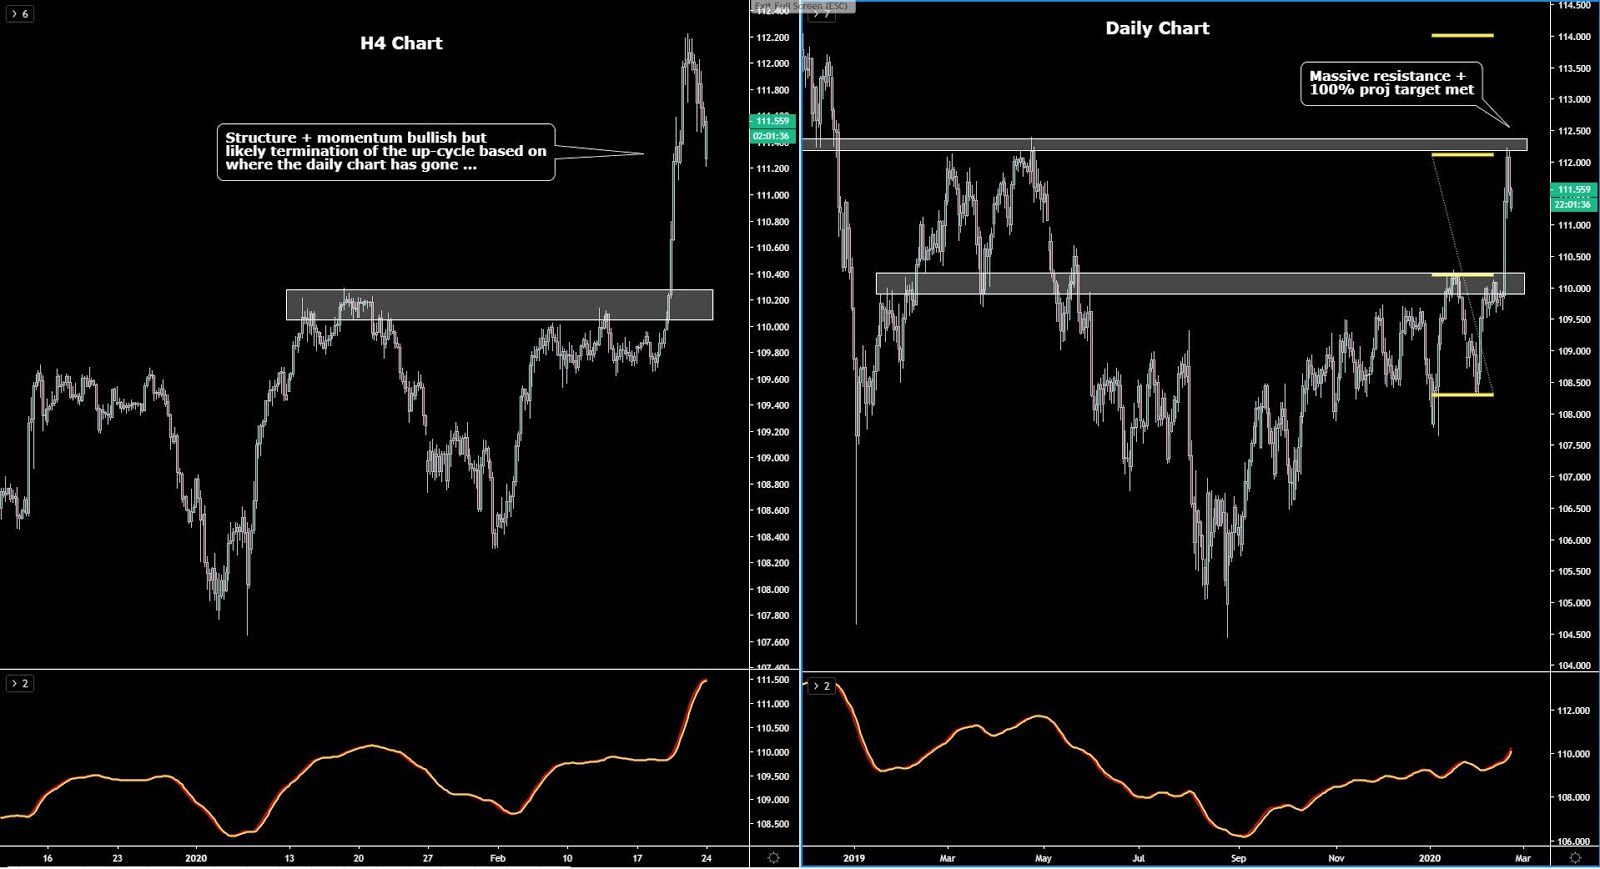
USD/JPY stopped in its tracks at the confluential level of the 100% projection, which blended perfectly with a macro horizontal level of resistance as shown in the daily chart below. This interaction with such strong resistance, coupled with the velocity of the rally, raises the prospects of an important top found, with a slow grind lower towards the next key level of support a potential scenario to be accounted for.
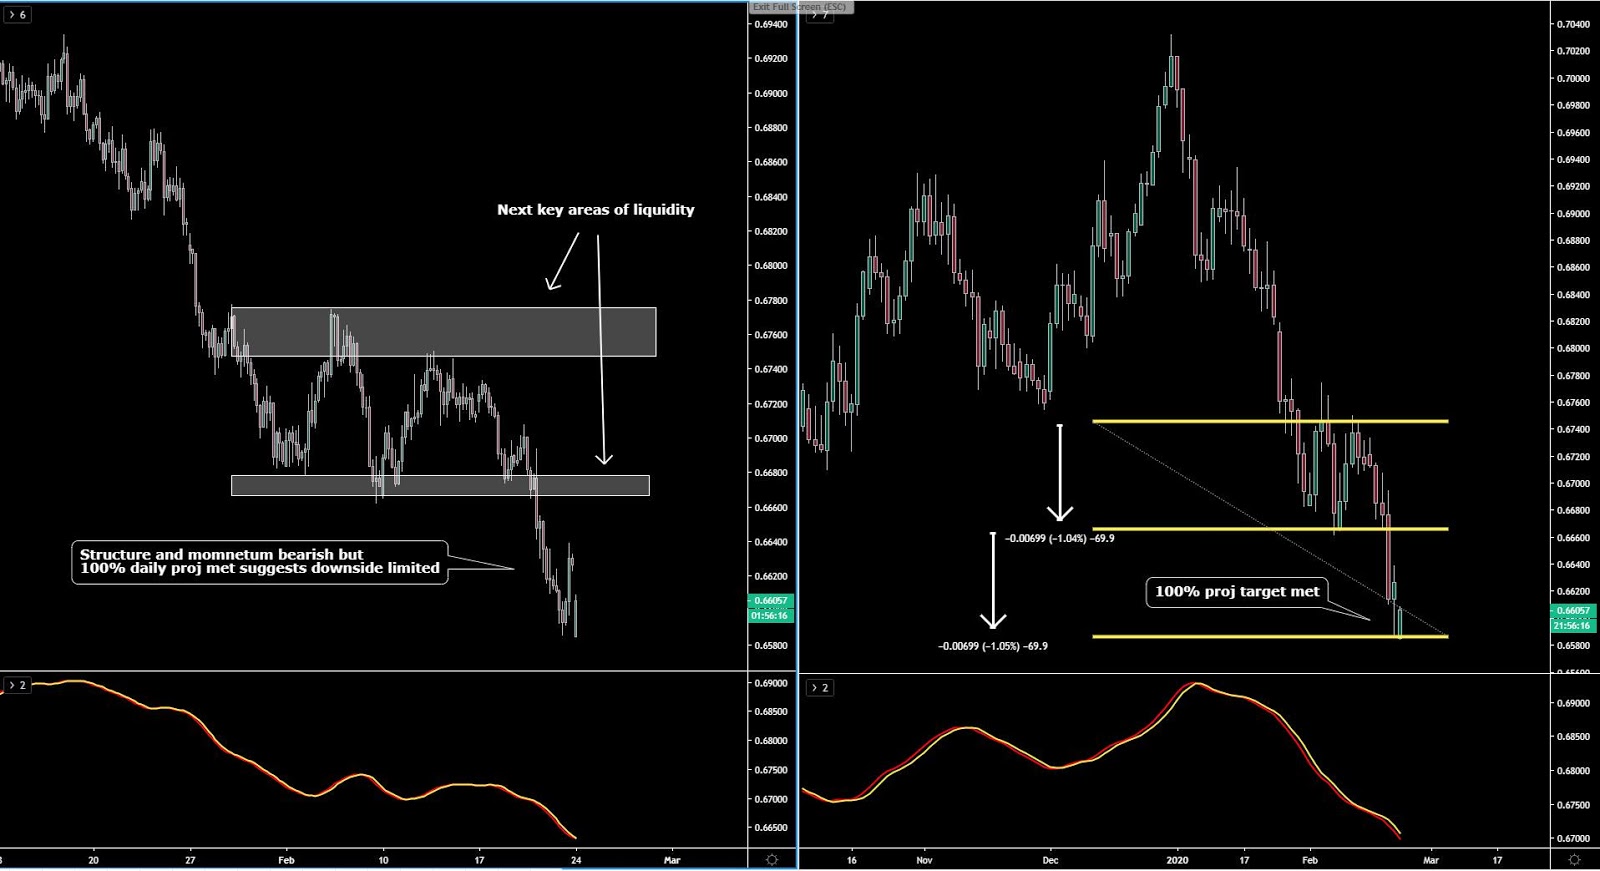
AUD/USD, as in the case of the EUR/USD, did also come into contact with the 100% projection target, which means the downside potential could be rather limited. It certainly doesn’t offer any value whatsoever, technically speaking, to be a seller if swing trading it. Further risk-off may see the bleed lower continue but this move would be mainly exploitable by scalper and momentum traders with strategies designed to be in and out within hours. One of the worst areas to keep adding positions short is when a bearish cycle is mature, as the AUD/USD daily shows. Apply patience, sideline yourself until the market comes back to key areas, and be ready then.
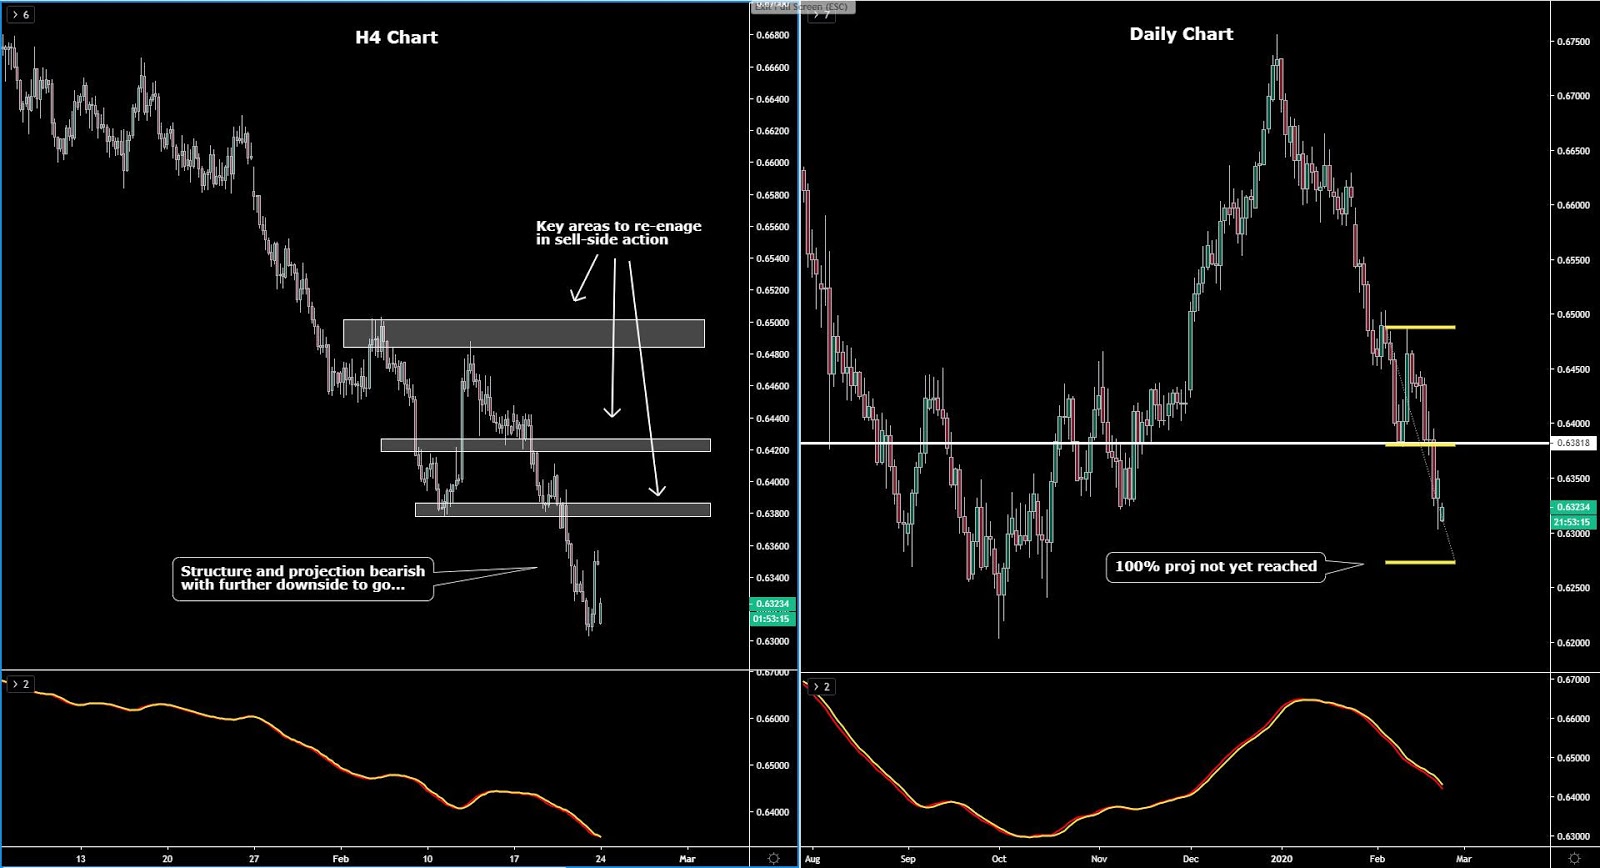
NZD/USD, unlike the AUD/USD, is yet to find a meaningful bottom judging by the current magnitude of its decline, as the market is yet to test the 100% proj target off the daily. What this means is that any rebound towards key technical areas represent an opportunity to short this market on the assumption that the bearish cycle is incomplete. The Kiwi is a currency with a clear risk of selling off as the COVID-19 pandemic keeps playing out.
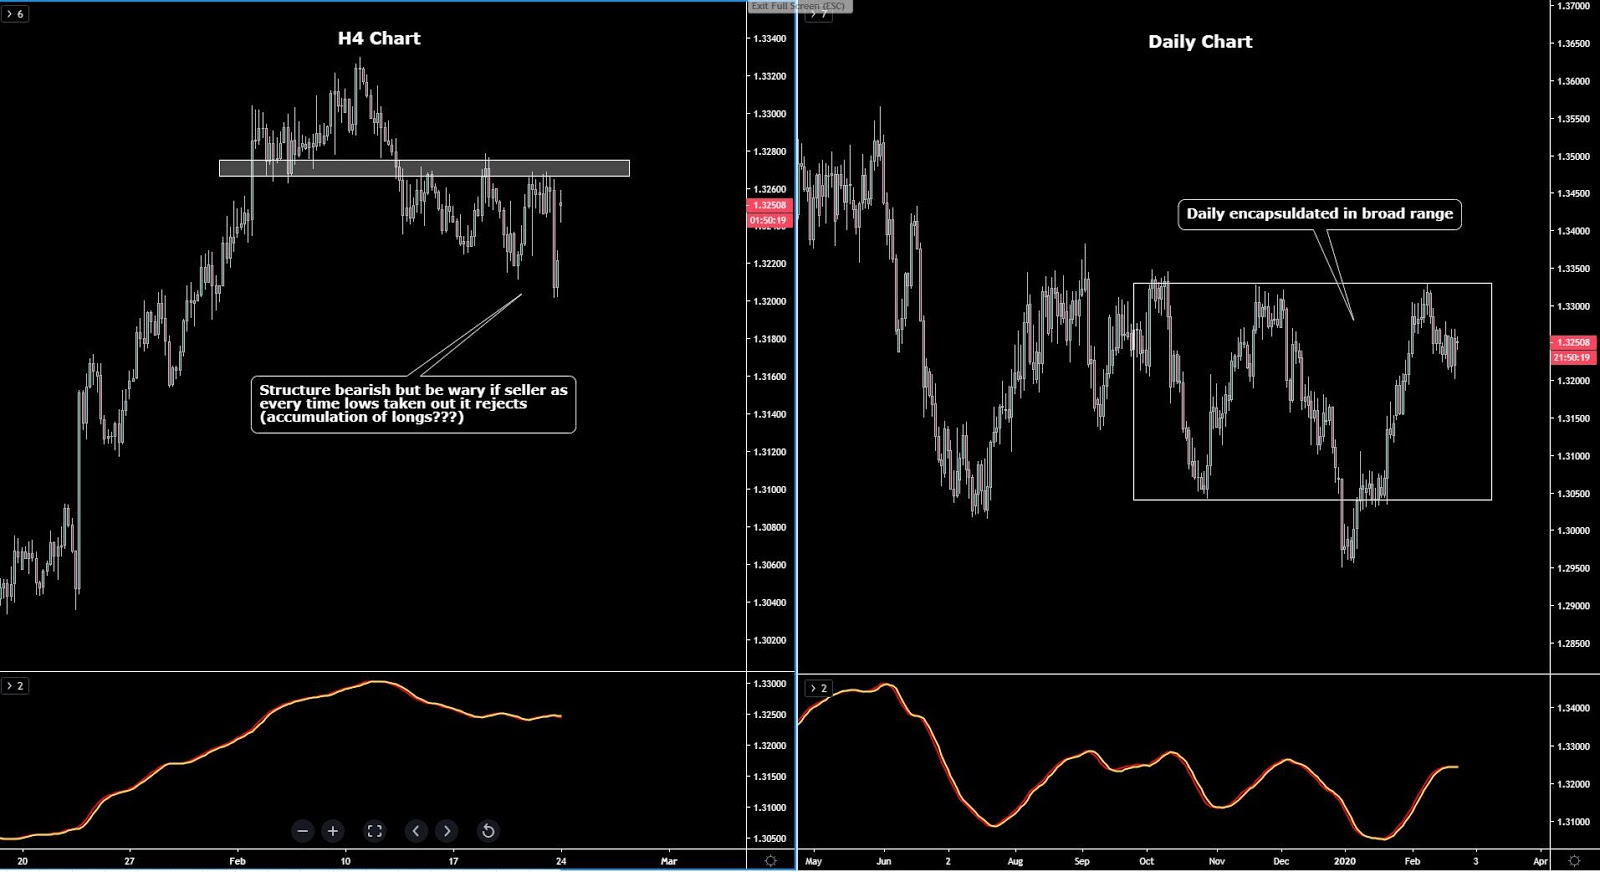
USD/CAD is a market that offers a rather murky picture, with the daily confined in a broad range. Considering that the topside of this consolidation has recently been tested, the pattern has been to see a rejection back down towards the opposite side. If that continues to play out, there is still significant downside up for grabs for the interest of sellers. By lowering our attention to the H4 chart, we can see that a breakout of structure to bearish has already occured, laying into this daily view of the range bottom-side to be the next macro move. However, the fact that every decline in the pair has failed to find acceptable into lower prices is a bad omen as it suggests low conviction by shorts and/or building of longs.
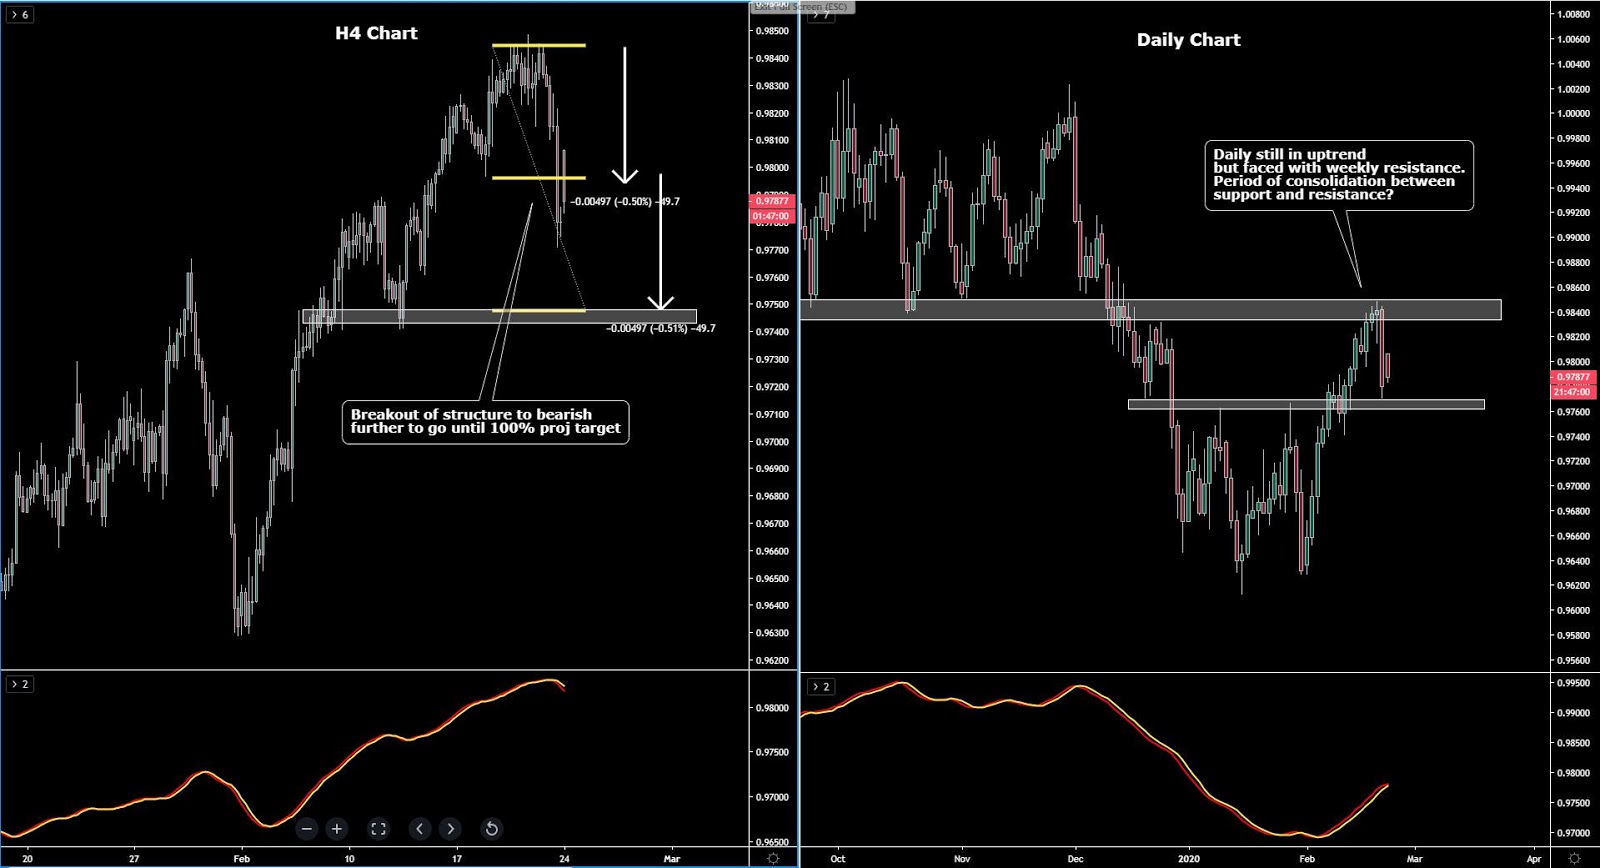
USD/CHF shows the type of price action one could have expected judging by the location it had reached in the chart. With the Swissy attracting most of the safe-haven bids in FX since the Yen debacle, alongside the juncture reached in the chart (weekly horizontal resistance), shorting it off these highs was a scenario to be on the watch for. The H4 chart starts to show clear cracks in the uptrend, with the structure of higher lows now violated, which increases the risks that this is a market that may start to shift its attention towards selling on rallies.
Important Footnotes
- Market structure: Markets evolve in cycles followed by a period of distribution and/or accumulation.
- Horizontal Support/Resistance: Unlike levels of dynamic support or resistance or more subjective measurements such as Fibonacci retracements, pivot points, trendlines, or other forms of reactive areas, the horizontal lines of support and resistance are universal concepts used by the majority of market participants. It, therefore, makes the areas the most widely followed and relevant to monitor.
- Fundamentals: It’s important to highlight that the daily market outlook provided in this report is subject to the impact of the fundamental news. Any unexpected news may cause the price to behave erratically in the short term.
- Projection Targets: The usefulness of the 100% projection resides in the symmetry and harmonic relationships of market cycles. By drawing a 100% projection, you can anticipate the area in the chart where some type of pause and potential reversals in price is likely to occur, due to 1. The side in control of the cycle takes profits 2. Counter-trend positions are added by contrarian players 3. These are price points where limit orders are set by market-makers.
