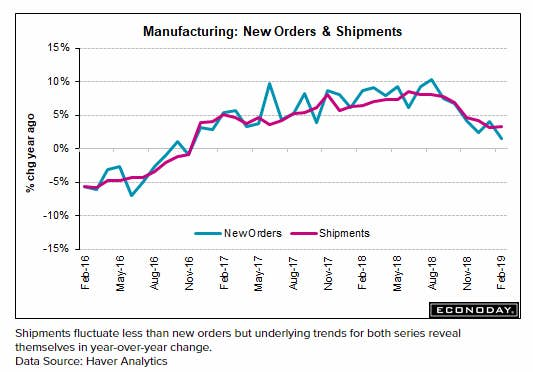
New orders fell an expected 0.5% and the trend is clearly negative.
The U.S. Census Bureau announces the February Full Report on Manufacturers’ Shipments, Inventories and Orders.
New Orders
New orders for manufactured durable goods in February, down following three consecutive monthly increases, decreased $4.2 billion or 1.6 percent to $250.5 billion, unchanged from the previously published decrease. This followed a 0.1 percent January increase. Transportation equipment, also down following three consecutive monthly increases, led the decrease, $4.1 billion or 4.5 percent to $86.2 billion. New orders for manufactured nondurable goods increased $1.5 billion or 0.6 percent to $247.0 billion.
Shipments
Shipments of manufactured durable goods in February, up three of the last four months, increased $0.5 billion or 0.2 percent to $258.5 billion, unchanged from the previously published increase. This followed a 0.5 percent January decrease. Computers and electronic products, up four of the last five months, led the increase, $0.3 billion or 1.0 percent to $28.0 billion. Shipments of manufactured nondurable goods, up following three consecutive monthly decreases, increased $1.5 billion or 0.6 percent to $247.0 billion. This followed a 0.1 percent January decrease. Petroleum and coal products, also up following three consecutive monthly decreases, led the increase, $1.4 billion or 2.8 percent to $51.9 billion.
Unfilled Orders
Unfilled orders for manufactured durable goods in February, down four of the last five months, decreased $3.6 billion or 0.3 percent to $1,177.6 billion, unchanged from the previously published decrease. This followed a 0.1 percent January increase. Transportation equipment, also down four of the last five months, led the decrease, $3.6 billion or 0.4 percent to $807.3 billion.
Inventories
Inventories of manufactured durable goods in February, up twenty‐five of the last twenty‐six months, increased $1.3 billion or 0.3 percent to $418.9 billion, unchanged from the previously published increase. This followed a 0.5 percent January increase. Transportation equipment, up five of the last six months, drove the increase, $1.3 billion or 1.0 percent to $134.1 billion. Inventories of manufactured nondurable goods, up two consecutive months, increased $0.7 billion or 0.3 percent to $268.9 billion. This followed a 0.6 percent January increase. Petroleum and coal products, also up two consecutive months, drove the increase, $0.9 billion or 2.3 percent to $40.2 billion. By stage of fabrication, February materials and supplies decreased 0.2 percent in durable goods and increased 0.2 percent in nondurable goods. Work in process increased 1.0 percent in durable goods and increased 0.5 percent in nondurable goods. Finished goods were virtually unchanged in durable goods and increased 0.2 percent in nondurable goods.
Econoday Comments
The lead chart is from Econoday.
Highlights
Very soft is the factory sector's current run. New orders fell a no surprise 0.5 percent in February following a revised no change in January and only a 0.1 percent increase in December. Stripping out aircraft and other transportation equipment, core durable orders have slipped 0.1 percent in the last two reports with a modest 0.3 percent gain the highlight for December.
Core capital goods (nondefense ex-aircraft) slipped 0.1 percent for both February orders and February shipments though these decreases do follow respective jumps in January of plus 0.9 and 1.0 percent in what are positive offsets for business investment.
But positives are scarce in this report with February durable goods orders down 1.6 percent (unrevised from last week's advance report as commercial aircraft swung lower) and total unfilled orders down 0.3 percent. Inventories at least, up 0.3 percent, aren't swelling as they are in the wholesale and retail sectors as total shipments in today's report rose 0.4 percent to keep the inventory-to-shipments ratio unchanged at 1.36.
Nondurable orders are a positive in the data, benefiting from higher petroleum-related prices and rising 0.6 percent to help offset the drop in durables. Directly facing the slowdown underway in global cross-border trade, the U.S. factory sector started to stumble late last year and, judging not only by this report but by two straight declines in manufacturing production (part of the industrial production) as well as a host of private and regional reports, has yet to find its footing so far in 2019.
Manufacturing peaked in August of 2018 and has been on a poor run since.
