Get 40% Off
🚨 Volatile Markets? Find Hidden Gems for Serious OutperformanceFind Stocks Now

S&P 500: Another Look At Volatility Points To Steady Bull Market

Published 01/22/2017, 12:57 AM
Updated 07/09/2023, 06:31 AM

This article takes an alternative view on volatility. Rather than the usual CBOE VIX - a volatility index derived from option pricing, the metrics below look at actual changes in prices. The index looked at is the S&P 500 (will have a look at a few other indexes later). The first chart shows the rolling 12 month count of days where the daily percent change exceeded +1% or was worse than -1%. The resulting indicator provides some interesting insights and potential signals...
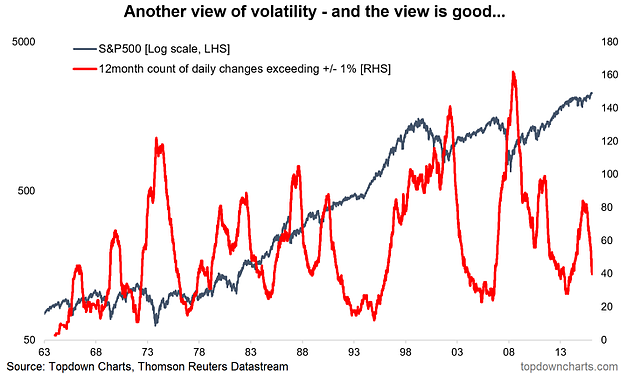
S&P 500 vs RHS 1963-2017

What sticks out to me is that the indicator rises into a correction or bear market and peaks at the bottom of the market e.g. 2016 bottom, 2011, 2009, 2003, and so-on. What's also interesting is when the indicator rolls over and heads below 50. Usually this happens when a bull market gets under way. We're seeing exactly this pattern right now.

It also highlights that there are two types of bull markets: a bull market where volatility rises (an erratic bull market), and a bull market where volatility falls and stays low (a steady bull market). At present we appear to be in the middle of a steady bull market, and these can go on for quite some time.

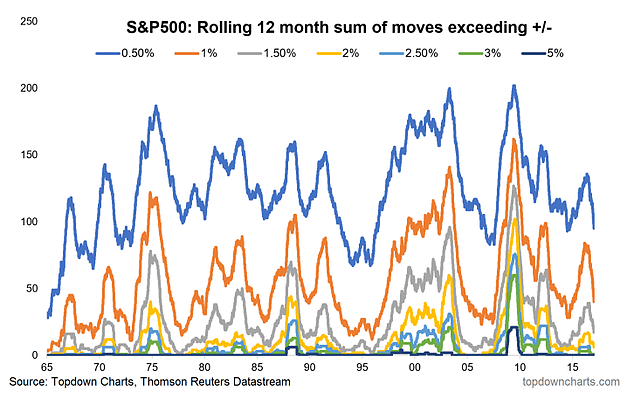
Finally, it's worth a quick look at the spectrum of moves. The following graph looks at the same indicator but for various different threshold magnitudes e.g. 0.5% and 5%. It gives a further insight into how erratically a market is moving... just compare and contrast 2008 with 2005.
3rd party Ad. Not an offer or recommendation by Investing.com. See disclosure here or remove ads .

S&P500 Rolling 12 Month Sum of +/- Moves 1965-2017

Taking alternative views of markets and economies is important. At Topdown Charts there is an emphasis on innovation, coming up with new indicators and new ways of analyzing the market as well as refining and leveraging our existing indicator set.

The analysis in today's article shows how another view of volatility can yield insights into how the market is behaving and give clues as to how it might evolve in the future. At present the clues point to a steady bull market following the 2016 bottom.

Latest comments

Risk Disclosure: Trading in financial instruments and/or cryptocurrencies involves high risks including the risk of losing some, or all, of your investment amount, and may not be suitable for all investors. Prices of cryptocurrencies are extremely volatile and may be affected by external factors such as financial, regulatory or political events. Trading on margin increases the financial risks.
Before deciding to trade in financial instrument or cryptocurrencies you should be fully informed of the risks and costs associated with trading the financial markets, carefully consider your investment objectives, level of experience, and risk appetite, and seek professional advice where needed.
Fusion Media would like to remind you that the data contained in this website is not necessarily real-time nor accurate. The data and prices on the website are not necessarily provided by any market or exchange, but may be provided by market makers, and so prices may not be accurate and may differ from the actual price at any given market, meaning prices are indicative and not appropriate for trading purposes. Fusion Media and any provider of the data contained in this website will not accept liability for any loss or damage as a result of your trading, or your reliance on the information contained within this website.
It is prohibited to use, store, reproduce, display, modify, transmit or distribute the data contained in this website without the explicit prior written permission of Fusion Media and/or the data provider. All intellectual property rights are reserved by the providers and/or the exchange providing the data contained in this website.
Fusion Media may be compensated by the advertisers that appear on the website, based on your interaction with the advertisements or advertisers.
© 2007-2024 - Fusion Media Limited. All Rights Reserved.