In the past 4 weeks there were at least 20 million Americans, who filed for unemployment benefits. News came out yesterday that UK is extending their lockdown by another three weeks. This morning, China has shown the world how badly its economy was affected by the coronavirus and the lockdown measures it was forced to undertake.
U.S. Jobless Claims Remain At Extreme Levels
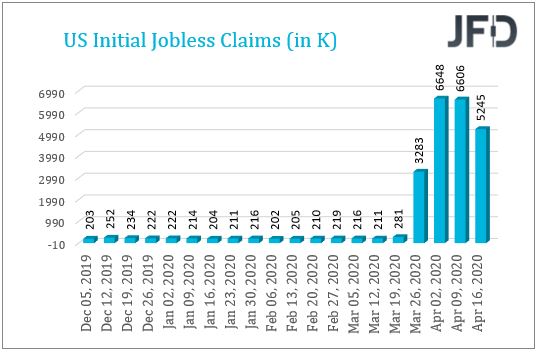
In the past 4 weeks there were at least 20 million Americans, who filed for unemployment benefits. The reason for that is that companies are laying off people due to the coronavirus pandemic, which swept across the world from the beginning of this year. Although governments across the globe are encouraging companies to try and safeguard people’s jobs, the reality is totally different, especially in the U.S.
The initial jobless claims number is a good example of that. Despite yesterday’s figure being slightly lower than the previous two, still, the figure is in millions. The actual number came out at +5245K, beating its initial estimate of +5105K. If we compare the numbers prior to the March 26th release, they were balancing slightly above the 200K mark.
Initially, the U.S. equities were seen trading in a mixed manner, after the U.S. opening bell yesterday, as it seemed that investors were slightly confused on how to proceed further with the fact that initial jobless claims rose again above their forecast, but the amount of deaths from COVID-19 in the U.S. declined slightly.
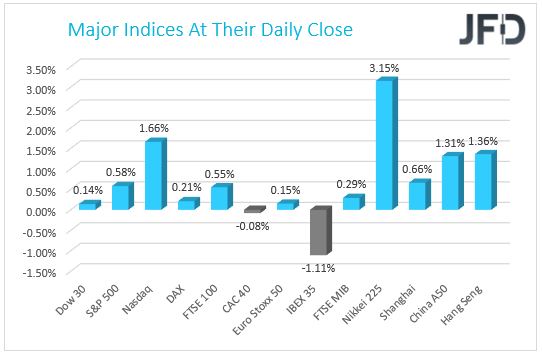
The U.S. dollar, which currently acts as a safe-haven, grinded higher for the second day in a row yesterday, against some of its major counterparts, like the JPY, CHF, GBP, EUR. That said, the greenback failed to gain against the commodity-dependant currencies such as AUD, NZD and NOK. But on the positive side, the US indices managed to push higher by the end of their trading sessions yesterday. Nasdaq was the best performer from the three, gaining around 1.66%.
This morning, we are seeing U.S. futures are holding on to their yesterday’s profits, as reports start to emerge of a drug and its testing results, which allegedly can fight the coronavirus. Although that sounds great, this still could be a short-term solution to help equities recover some of the recent losses. Market participants will eventually understand that the global economy has been shaken by this pandemic and the road to the pre-virus levels could have too many obstacles on its way.
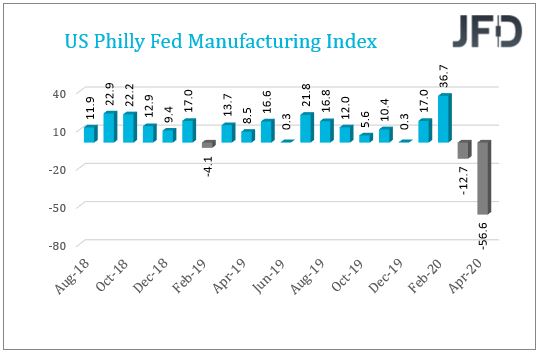
Another bad set of economic data, which we got from the US was the Philadelphia Fed manufacturing index. The figure came out at a disappointing -56.6. Last time this number was so low was back in 1975, falling to -57.9. Despite the data coming out much worse than the initial projections, investors are mainly focusing on the coronavirus situation, at the moment. Once this is out of the way, everyone can go back to evaluating the battered economic data and, which might cause another decline in the market.
Nasdaq 100 – Technical Outlook
Yesterday, the Nasdaq 100 managed push higher again, coming very close to its key resistance barrier near the psychological 9000 level. Looking at the cash index, we can see that there is currently a hold-up near that zone, which may force the price to decline slightly. However, as long as the index stays above its short-term upside support line taken from the low of April 3rd, we will stay somewhat bullish.
If Nasdaq 100 struggles to overcome the psychological 9000 barrier straight away, this could cause a small correction towards the aforementioned upside line. If that line provides decent support for the index, the buyers may take advantage of the lower price and push it higher again. A break of the 9000 area would confirm a forthcoming higher high and more bulls might jump in. This could send Nasdaq 100 to the next potential resistance hurdle, at 9217, marked by the high of February 25th.
Alternatively, if the previously-mentioned upside line breaks and the price falls below the 8497 hurdle, which is the low of April 15th, this might spook the bulls from the field temporarily. The index could then drift to the 8313 obstacle, a break of which may lead to the psychological 8000 zone, marked near the high of March 31st and near the low of April 8th.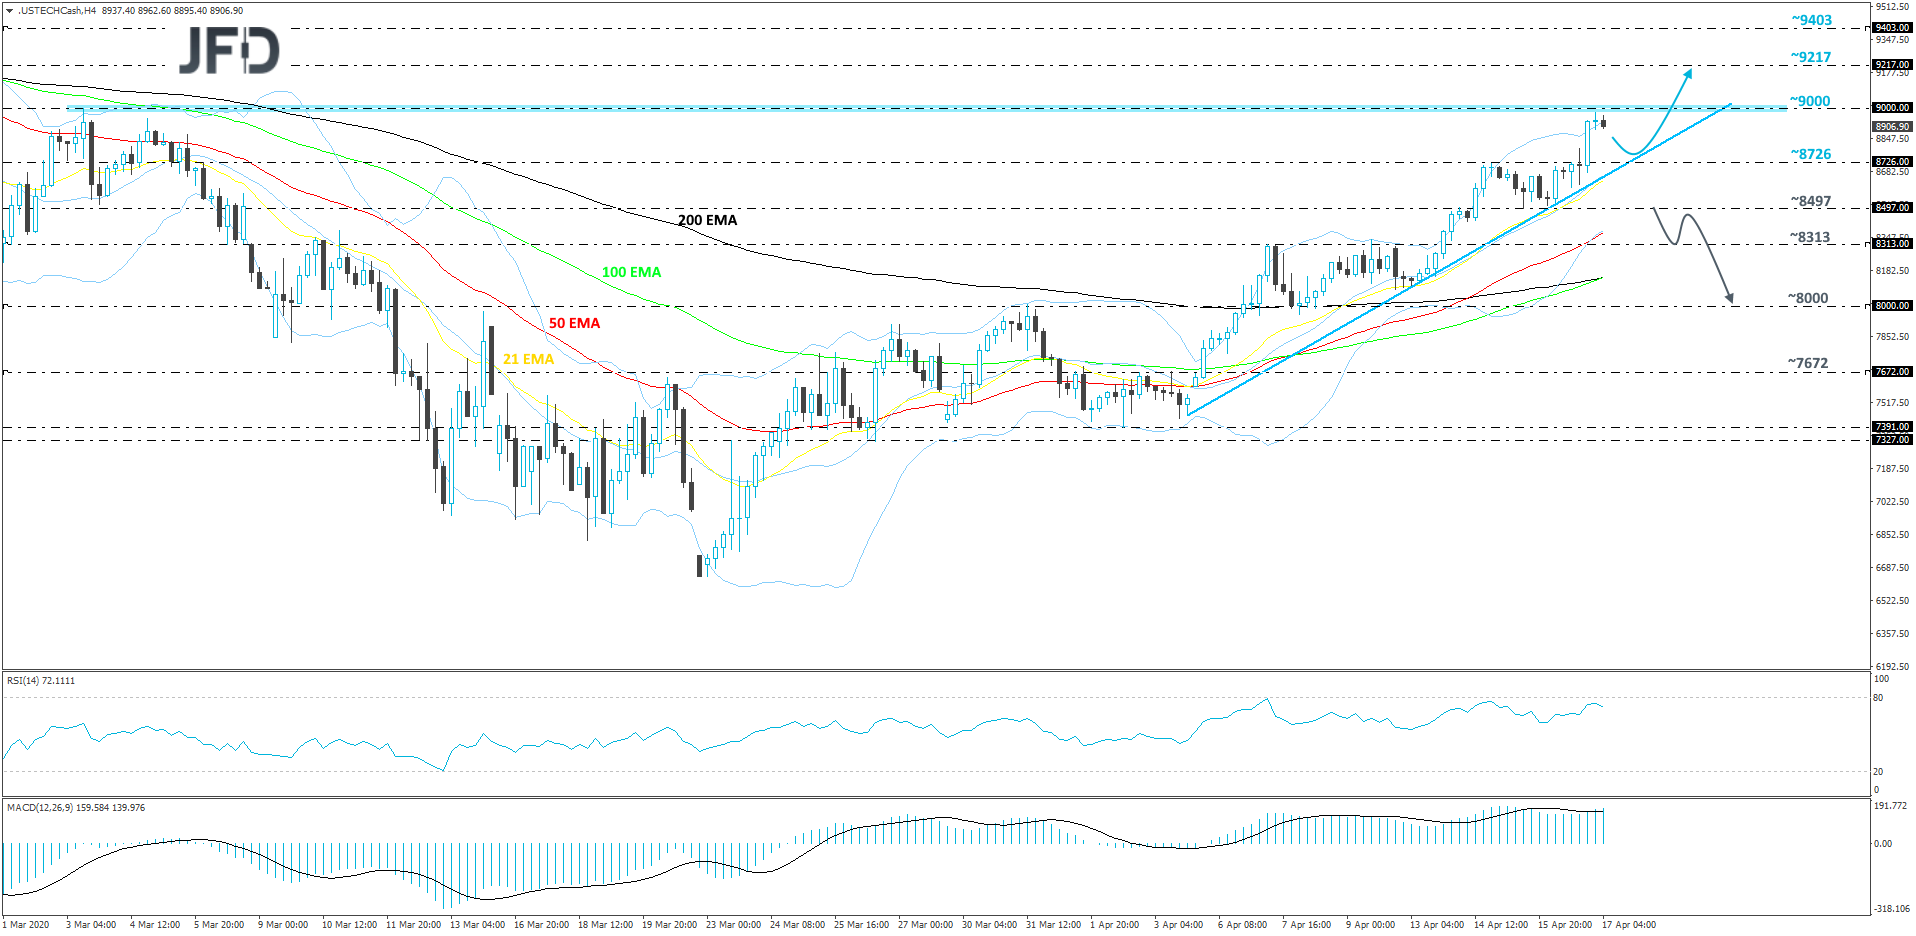
Coronavirus Deaths Diminishing Very Slowly And UK Extends Lockdown
Although there was a slowdown in the total amount of coronavirus infections globally, still, the figure has surpassed 2.1 million. Some governments continue with the lockdowns. News came out yesterday that UK is extending their lockdown by another three weeks. The message was delivered by UK’s foreign minister Dominic Raab, who made the announcement during his press conference.
The FTSE 100 closed slightly in the positive territory yesterday, but the British pound was among the losers, gaining only fractionally against the JPY, CHF and EUR. Given that the official lockdown in UK got extended for another three weeks, UK’s FTSE 100 might remain under some pressure, as investors could see this move by the government as a sign of worry. But as we said earlier, market participants might focus on the official coronavirus statistics instead.
China’s GDP Sets A Record
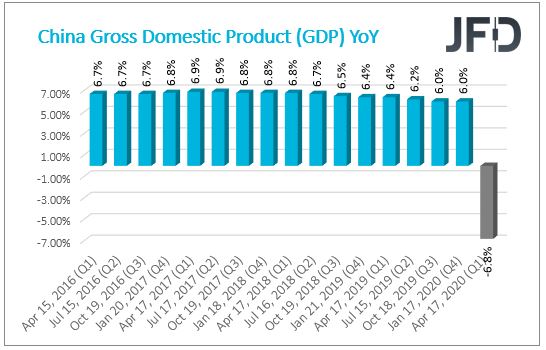
This morning, China has shown the world how badly its economy was affected by the coronavirus and the lockdown measures it was forced to undertake. The YoY GDP came out worse that the previously expected -6.5%. The actual reading showed up at -6.8%, which puts China into the contractionary territory for the first time in history. At least since the reporting started in 1992.
Although the number was already believed to be well below zero, it disappointed even more. Similar situation is with the QoQ reading, which also showed a historic low. The figure came out at -9.8%, which is slightly better than the initial expectation of -9.9%. Chinese industrial production reading on a YoY basis surprised many economists, as it showed up way better than the forecasted -7.3%. The actual number was only at -1.1%.
USD/CNH – Technical Outlook
Recently, USD/CNH pushed back above all of its EMAs on the 4-hour chart, this way giving a bit more hope to the buyers. There is a small chance for the pair to drift a bit more to the upside, as our oscillators, the RSI and the MACD, are currently pointing slightly higher. That said, the rate still remains below a short-term tentative downside resistance line taken from the high of March 19th, which may force USD/CNH to drift down again later on. Overall, we will stay somewhat bearish.
A push above the current high of this week, at 7.0922, could help lift the rate a bit higher. That said, the pair may get a hold-up around there. If USD/CNH struggles to overcome that line, this might be a sign for the bears to step in and take control again. If so, the rate could drift back down, cross the 7.0922 obstacle and aim for today’s current low, at 7.0679. If that area is still no match for the sellers, its break could clear the path to the 7.0365 level, marked by the current lowest point of April.
Alternatively, if the aforementioned downside line breaks and the rate climbs above the 7.1194 barrier, marked by the high of April 3rd, this would confirm a forthcoming higher high and more buyers may join in. The pair might then travel to the current highest point of April, at 7.1419, a break of which could increase the chances for USD/CNH to travel further north, possibly targeting the 7.1649 level. That level is the current highest point of 2020.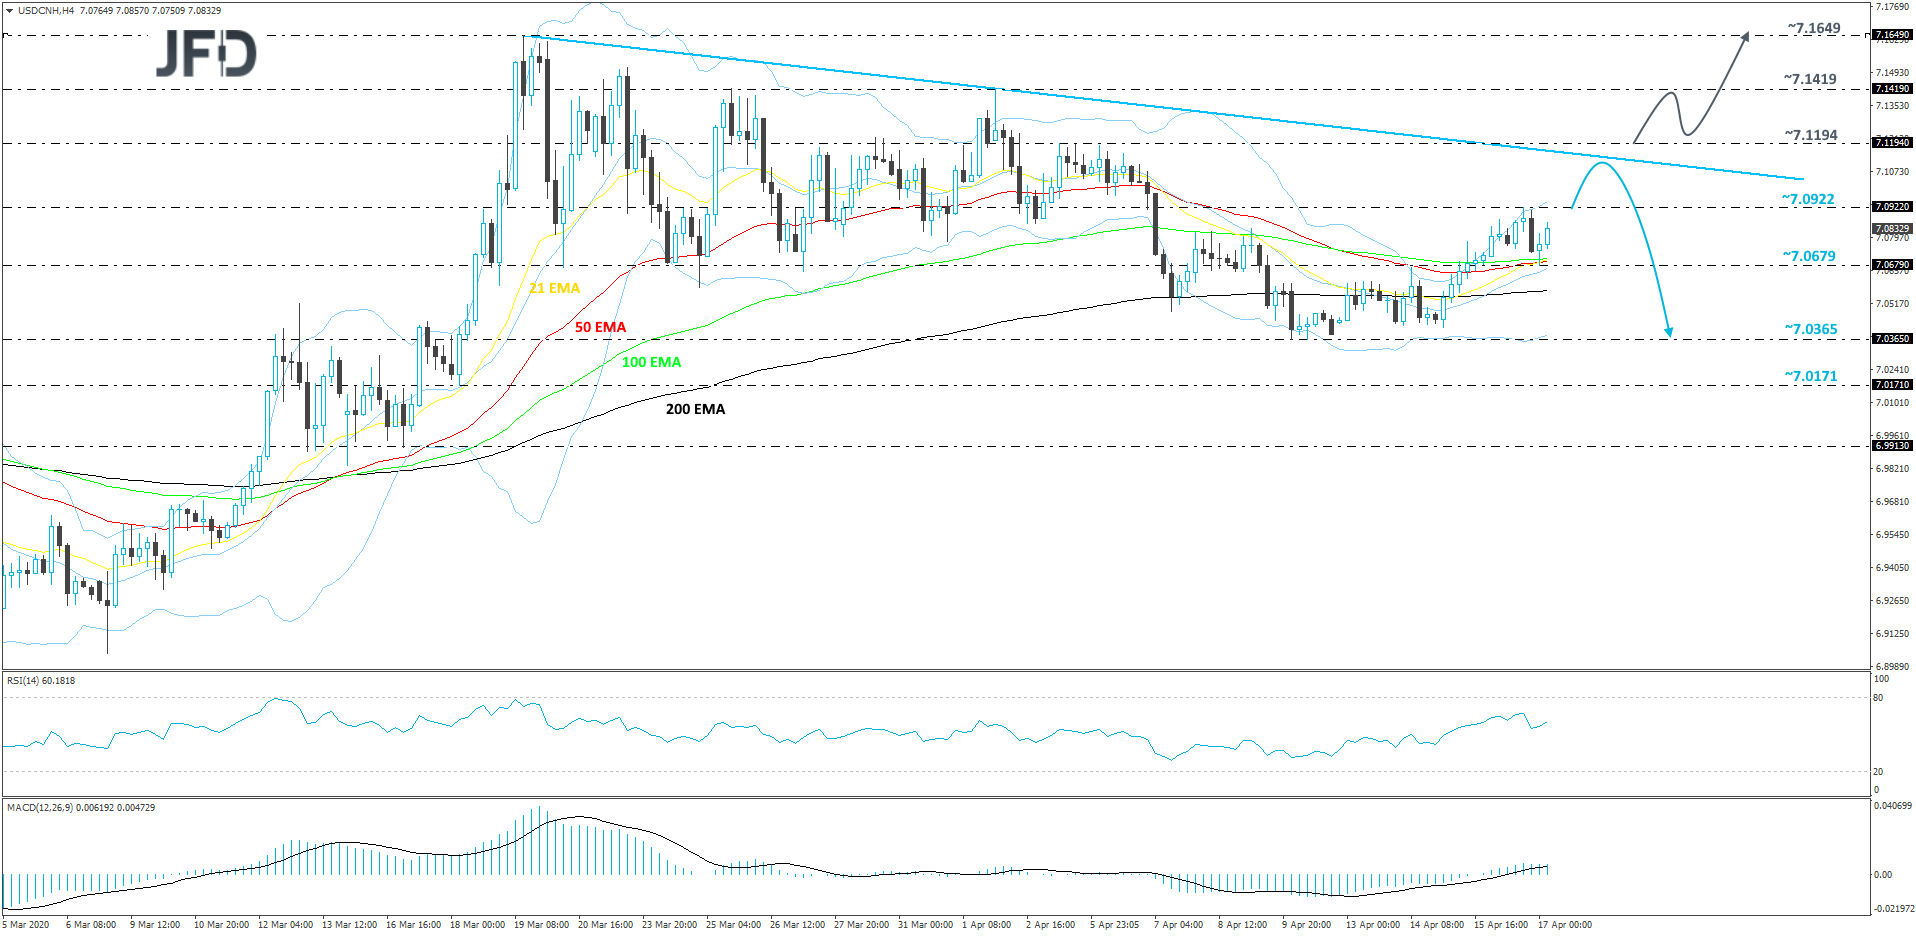
As for the rest of today’s events
The main focus on the economic calendar for today will be on the eurozone inflation numbers for the month of March. The core MoM and YoY figures are believed to have remained the same, at +1.1% and +1.0% respectively.
The headline YoY reading is also expected to have stayed the same, at +0.7%, whereas the MoM number is forecasted to have risen from +0.2% to +0.5%. If all the figures come out as expected, this might not have a huge affect on the EUR. But if we see the readings worsening slightly, then the common currency may come under more selling pressure and continue with the slide, which we are seeing this week.

