The latest earnings reporting season seemed to contribute to the sharp selloff in stocks during October, as some companies reported bullish earnings that were more than offset by bearish guidance about future earnings prospects. Collectively, however, the S&P 500 companies’ Q3 earnings results reported through the 11/8 week were 4.9% better than analysts had expected during the 9/28 week, i.e., just before the start of the latest earnings season (Fig. 1). As I’ve noted many times before, this pattern is par for the course. (The pattern shows up on our “earnings squiggles” data series as a hook at the end of the line—see our S&P 500 Earnings Squiggles Annual & Quarterly.)
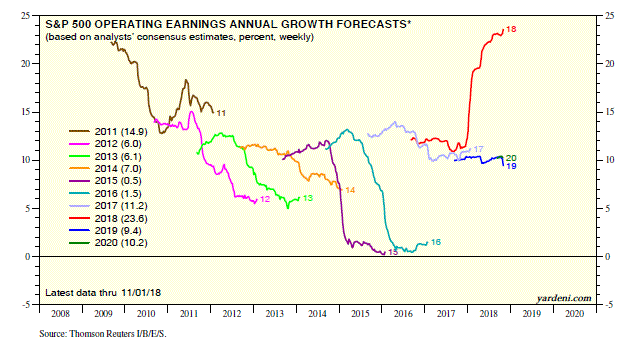
In aggregate, the negative guidance corporate managements provided during earnings conference calls somewhat deflated analysts’ consensus earnings estimates for Q4-2018 and the quarters of 2019 (Fig. 2). However, the 2018 estimated earnings growth rate held steady during the 11/1 week from the week before at 23.6%, the highest reading ever for this data series (Fig. 3 and Fig. 4). The 2019 estimated growth rate edged down to 9.4%. The 2020 projected growth rate remained solid at 10.2%.
In other words, the Q3 results didn’t curb analysts’ enthusiasm for earnings growth this year and the coming two years. I, however, curbed my enthusiasm for the earnings outlook on October 30. Here’s more on why I did so:
(1) Me vs them. I lowered my estimates for earnings growth during 2019 and 2020 to 4.9% and 5.3% from 6.8% and 8.8%. I am predicting S&P 500 earnings per share will be $162 this year, $170 next year, and $179 in 2020 (Fig. 5). During the 11/8 week, the comparable analysts’ consensus estimates were $162.67, $177.69, and $194.55.
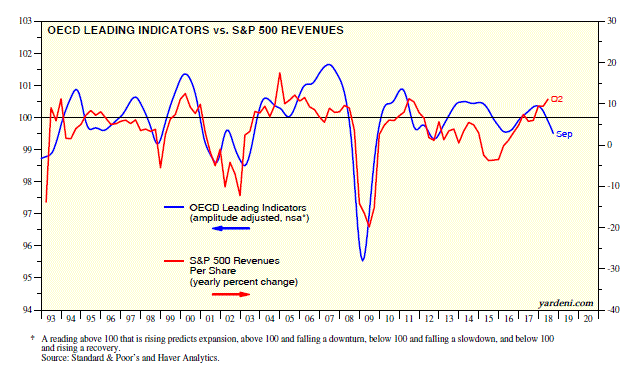
(2) Revenues slowdown ahead. The growth rate of S&P 500 revenues has been remarkably strong this year, which has contributed—along with the corporate tax rate cut at the end of last year—to the strength in earnings growth. Revenues per share rose 11.2% y/y during Q2, the highest growth rate since Q2-2011 (Fig. 6).
Industry analysts are expecting a slowdown in revenues-per-share growth from 8.5% this year to 5.5% in 2019 and 4.4% in 2020 (Fig. 7). That makes sense to me, since the trend growth rate of revenues has been roughly 4.0% (Fig. 8).
In addition, the global economic outlook is deteriorating, as evidenced by the weakening trends in recent months in both the OECD Leading Indicators and the Global Composite PMI (Fig. 9 and Fig. 10).
(3) Profit margin unlikely to set new records. What doesn’t make sense to me is the implication of analysts’ consensus earnings and revenues estimates that the S&P 500 operating profit margin will continue to rise to record highs. Their latest numbers imply that the profit margin will rise from 11.9% this year to 12.4% next year and 13.1% in 2020 (Fig. 11). For perspective, Thomson Reuters data show that the operating profit margin rose to a record-high 10.9% at the end of 2017 before the corporate tax cut. After the cut, it rose to fresh record highs of 11.9% during Q1 and 12.3% during Q2 (Fig. 12).
During the Q3 earnings season, many company managements warned that, in addition to their revenues growth being weighed down by the global economic slowdown, their profit margins were likely to be squeezed by higher labor costs as well as the impacts of tariffs, which were raising their materials costs and disrupting their supply chains. They didn’t say whether they expected to offset some of those higher costs with productivity gains.
So I don’t expect the S&P 500 profit margin to rise further from here. If it remains flat in record-high territory over the next two years, then earnings growth will match revenues growth. And if that happens, then industry analysts will be lowering their heady growth rates for earnings.


