On this trading blog, we frequently do educational reviews of actual stock or ETF swing trades taken in our Wagner Daily newsletter, so that traders may continually learn the details behind the stock trading strategy we have been consistently and profitably using for years. Today, we analyze the technical setup and subsequent result of a profitable breakout swing trade in InterOil Corporation (IOC).
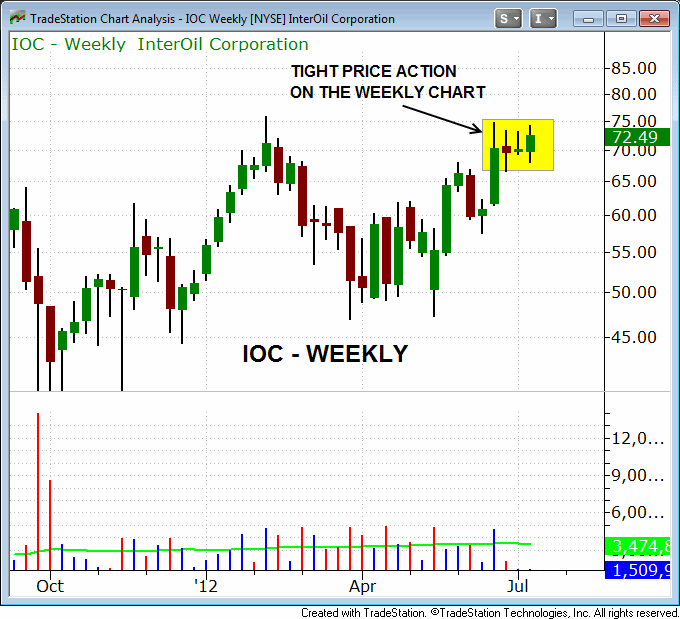
When scanning thousands of stocks and ETFs for equities that meet our disciplined, rule-based criteria for potential trade entry every night, the first thing we do is look at the longer-term weekly charts, which gives us a “big picture” snapshot of the overall trend of the stock or ETF. For the “breakout” entry, one of our prerequisites is a tight pattern of consolidation (“basing pattern”) near its recent highs. As you can see on the weekly chart of IOC below, the stock had been forming a tight base near its highs for nearly four weeks:
With a tight pattern on the weekly chart meeting our criteria, we then dropped down to the shorter-term daily chart interval, in order to locate a potential low-risk buy entry point within the valid basing pattern on the weekly chart.
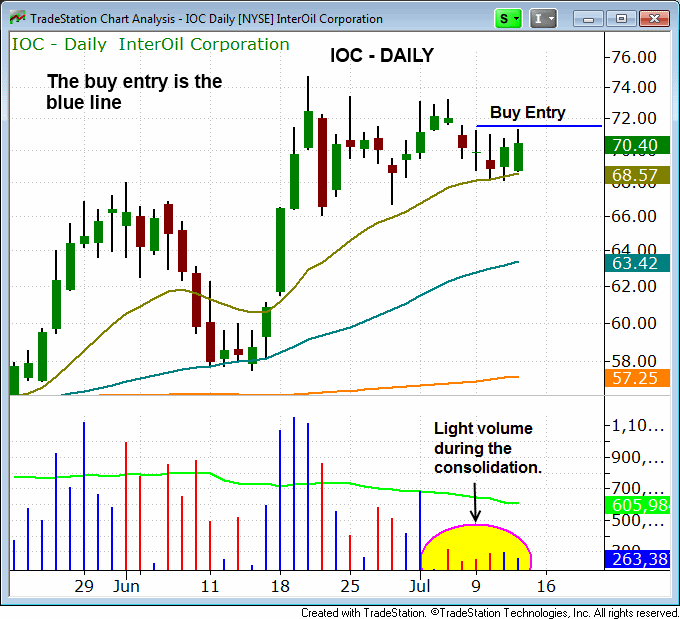
When buying breakouts (just one of the three types of technical swing trading buy setups we enter), we prefer to do so with stocks and ETFs that are consolidating near their 52-week highs and have been trading in a tight range over the past three to six weeks (or longer). As the daily chart below illustrates, the price action of IOC was holding above its 20-day exponential moving average (the beige line), in a narrow range, for the preceding three weeks.
Therefore, we had a valid technical pattern in place, and the trigger for potential buy entry was determined to be a rally above near-term resistance of the 4-day high. Regular subscribers of our Wagner Daily stock newsletter were alerted with our predetermined, exact entry and exit prices for this potential breakout entry in IOC on the evening of July 12:
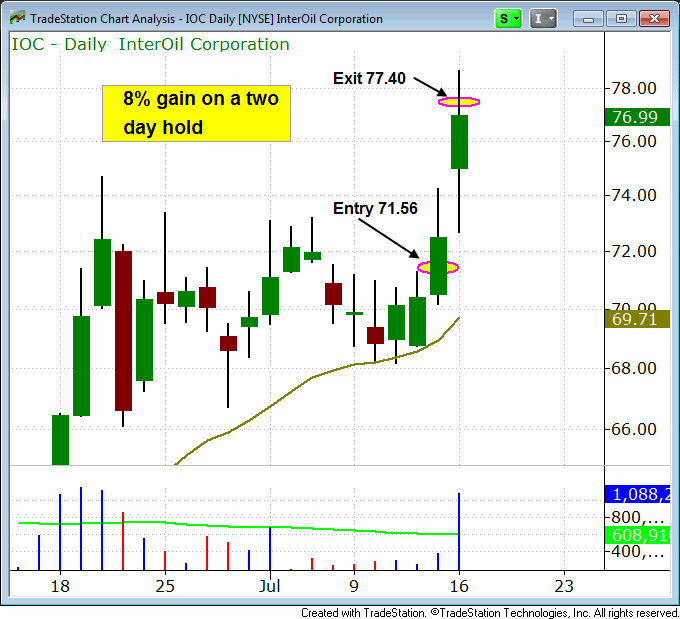
IOC triggered our buy entry above its four-day high (blue horizontal line above) the following day, and followed through nicely to the upside that morning before pulling back in the afternoon. With a pre-entry price target of $77.40, we held on to IOC in hopes of achieving a 2 to 1 reward to risk ratio on the trade (potential gain based on the target being at least double the potential loss based on the preset stop price).
In the very next trading session (July 16), IOC opened much higher and held on throughout the day, pushing to a greater gain throughout the afternoon and reaching our original price target of $77.40, enabling us to lock in a quick 8% gain on just a 2-day holding period. The final chart below shows the price action subsequent to our swing trade entry point:
Typically, our average holding time for most short-term stock and ETF trades is about 1 to 3 weeks (not days). However, sometimes the trade works in our favor by hitting our price target much faster than expected, in which case we simply take the quick profit and run.
For those who are new to this swing trading blog, or our stock trading strategy, we will eventually see more trades like this when our market timing model eventually shifts back to “confirmed buy” mode. If you have only been following this blog within the past month or two you have only seen us operate primarily in “capital preservation mode,” where we enter all new trades with both reduced share size and tight stops.
When market conditions are choppy and indecisive, very few stocks and ETFs follow-through in either direction of the market. As such, we prefer to lay low and play solid defense during these periods, holding on to well-earned profits from the easier periods in the market. Overall, there is no point in taking on heavy capital exposure when risk is high and the reward is low. When conditions are in our favor, we confidently get aggressive with our share size and exposure with the expectation of maximizing profits while the market is in a steadily trending mode. But until that happens, there is no sense in churning one’s brokerage account just for the sake of being active in the market. Patient, disciplined traders will always be rewarded the most.
Original post
- English (UK)
- English (India)
- English (Canada)
- English (Australia)
- English (South Africa)
- English (Philippines)
- English (Nigeria)
- Deutsch
- Español (España)
- Español (México)
- Français
- Italiano
- Nederlands
- Português (Portugal)
- Polski
- Português (Brasil)
- Русский
- Türkçe
- العربية
- Ελληνικά
- Svenska
- Suomi
- עברית
- 日本語
- 한국어
- 简体中文
- 繁體中文
- Bahasa Indonesia
- Bahasa Melayu
- ไทย
- Tiếng Việt
- हिंदी
Analysis Of A Recent Swing Trade: 8% Gain On A 2-Day Hold
Published 07/18/2012, 01:32 AM
Updated 07/09/2023, 06:31 AM
Analysis Of A Recent Swing Trade: 8% Gain On A 2-Day Hold
3rd party Ad. Not an offer or recommendation by Investing.com. See disclosure here or
remove ads
.
Latest comments
Install Our App
Risk Disclosure: Trading in financial instruments and/or cryptocurrencies involves high risks including the risk of losing some, or all, of your investment amount, and may not be suitable for all investors. Prices of cryptocurrencies are extremely volatile and may be affected by external factors such as financial, regulatory or political events. Trading on margin increases the financial risks.
Before deciding to trade in financial instrument or cryptocurrencies you should be fully informed of the risks and costs associated with trading the financial markets, carefully consider your investment objectives, level of experience, and risk appetite, and seek professional advice where needed.
Fusion Media would like to remind you that the data contained in this website is not necessarily real-time nor accurate. The data and prices on the website are not necessarily provided by any market or exchange, but may be provided by market makers, and so prices may not be accurate and may differ from the actual price at any given market, meaning prices are indicative and not appropriate for trading purposes. Fusion Media and any provider of the data contained in this website will not accept liability for any loss or damage as a result of your trading, or your reliance on the information contained within this website.
It is prohibited to use, store, reproduce, display, modify, transmit or distribute the data contained in this website without the explicit prior written permission of Fusion Media and/or the data provider. All intellectual property rights are reserved by the providers and/or the exchange providing the data contained in this website.
Fusion Media may be compensated by the advertisers that appear on the website, based on your interaction with the advertisements or advertisers.
© 2007-2024 - Fusion Media Limited. All Rights Reserved.
