Bears have pushed Ethereum down to the lowest lows. Is there room for the drop? What will happen to Ethereum next? In this post the following tools are applied: trend analysis, key levels analysis, volume analysis, Ichimoku, oscillators, Fibonacci arcs and time zones.
Dear friends,
The cryptocurrency market movements and growing general pessimism make me revise my view on the cryptocurrency and assess its future even more critically.
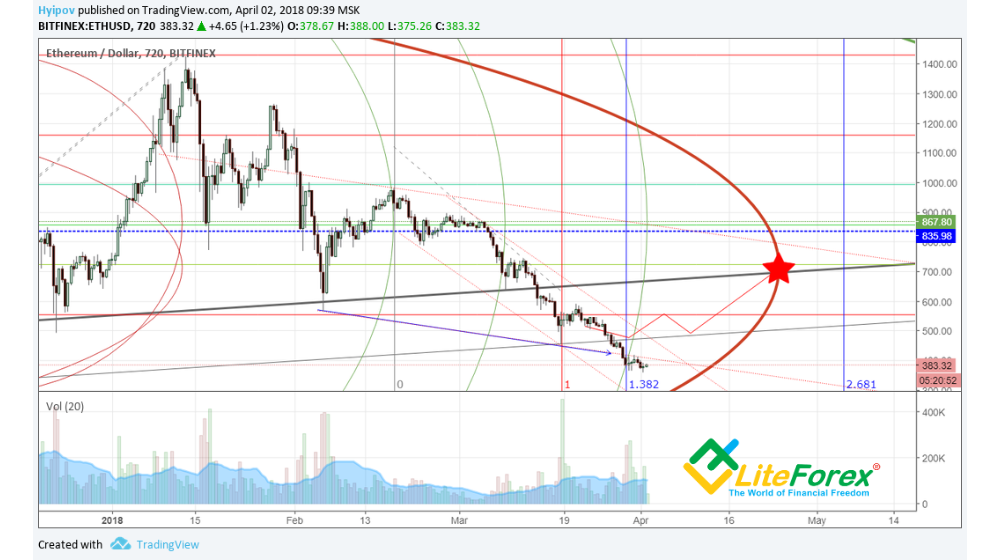
Unfortunately, the last forecast for Ethereum didn’t meet my hopes, and the ticker broke out the important support level.
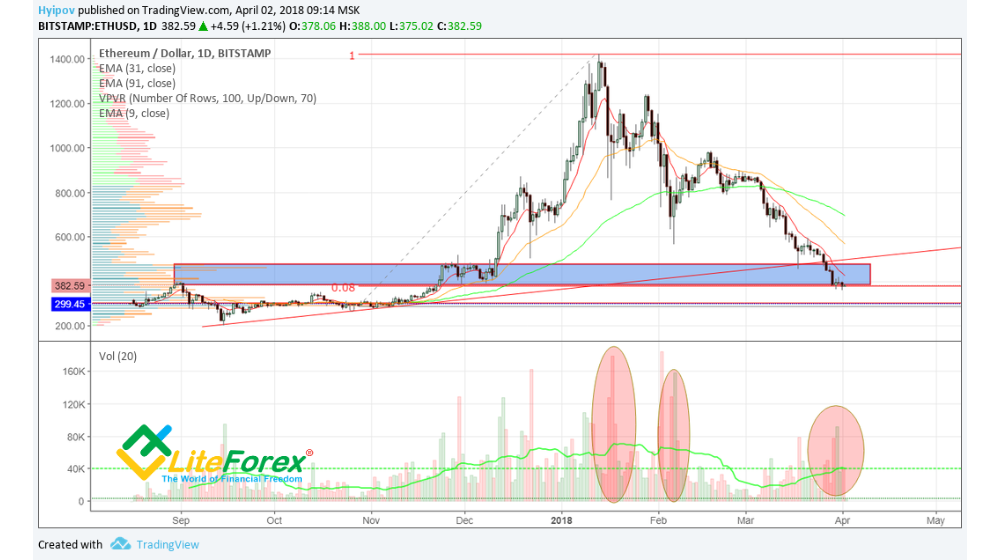
In the chart above, we see that Ethereum price has already been corrected by 92% of its uptrend, however, despite low prices, I don’t recommend buying. For now, Ethereum is at the support lower border; its breakout can drop ETH down to the unbelievable level of 300 USD.
It is also supported by the prospects of possible rental charge for storing data in the Ethereum blockchain, as well as the possible increase in the amount of coins from the current 98.5 million to 120 million ETH for “economic stability”.
In addition, the old Bitcoin itself presses altcoins down. All this puts a strong pressure in ETH rate will continue pressing for some time. Therefore, despite good prices, from the fundamental point of view, the fall may not be limited by the current levels.
If we take another look at the chart, we will see active accumulating at the current levels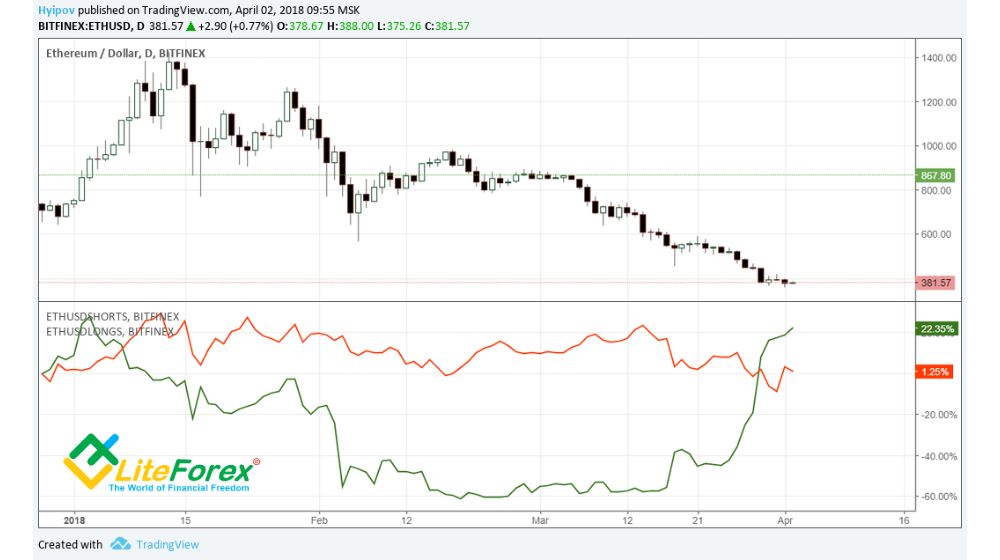
According to the volumes of long and short positions opened, traders are trying to stop the decline at the current levels.
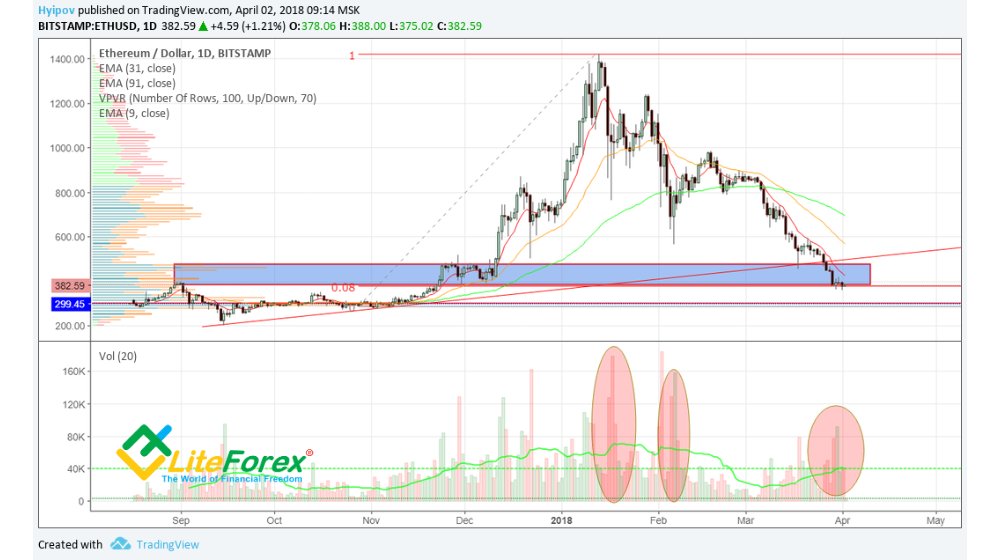
However, it is clear, investors still doubt that the current levels will be held. As it is seen in the chart above, the volumes are much lower than they were during the corrections of the previous declines (see red circles). If we look at long timeframes, bears are still ruling the ETH/USD pair.
Ichimoku indicates the same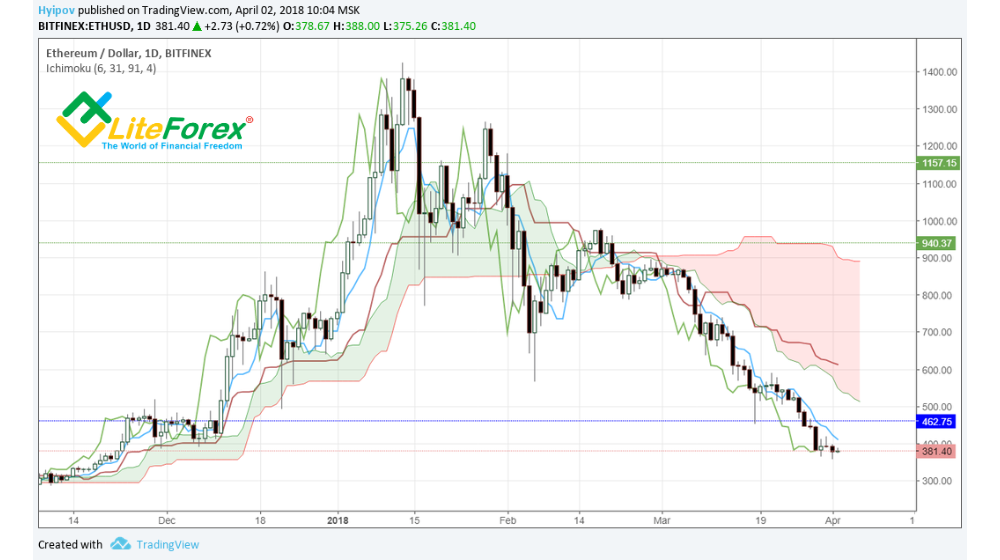
As well as the oscillators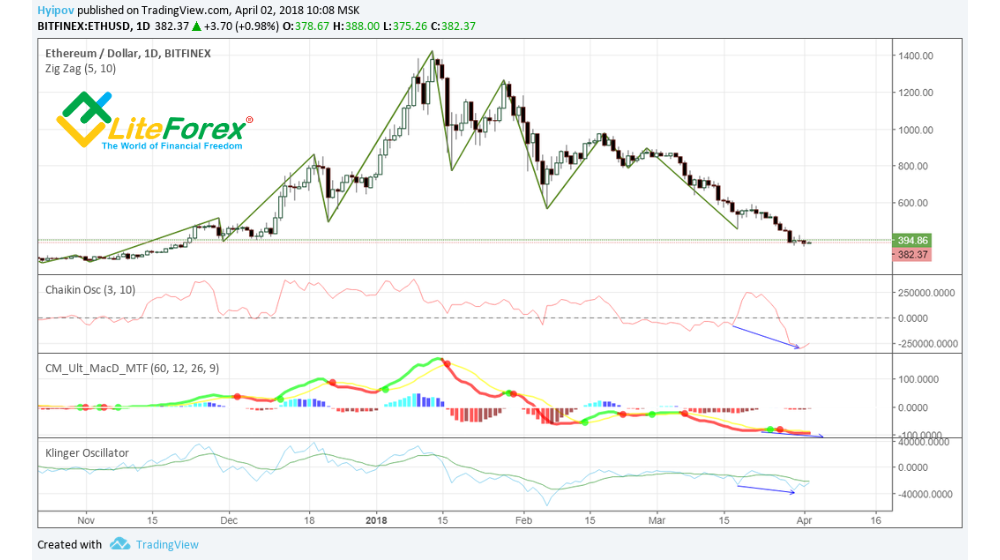
Finally, we can sum up that buyers are not very interested in Ethereum yet. So, without whales’ support, Ethereum is likely drop deeper. Nevertheless, in the short term, it can and should rebound from such a dramatic fall.
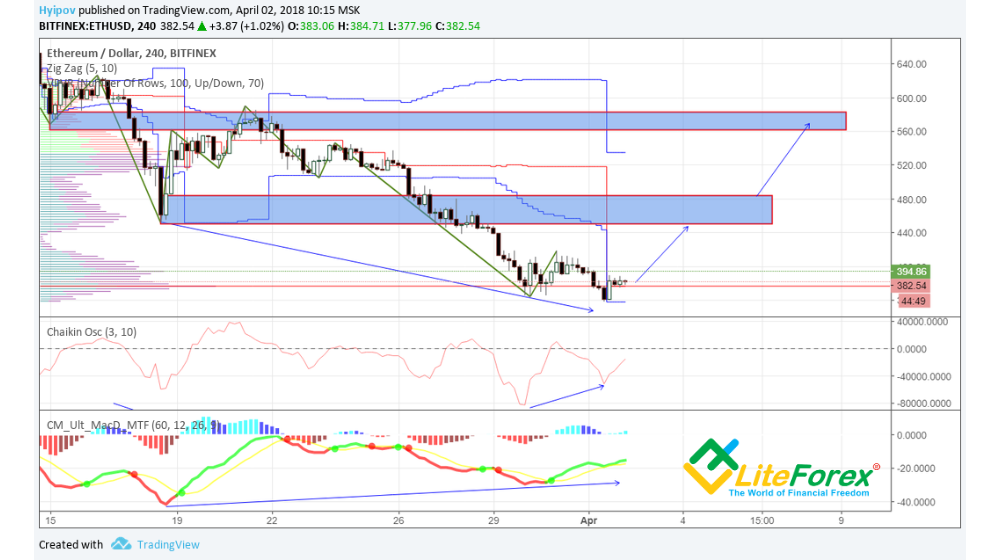
In 4-hour chart we see a number of divergences that suggest a potential rebound. However, the distance is too short for bulls, the next target and the strong resistance zone will emerge already near the levels of 440 – 480 USD. If buyers succeed, then there is a possible way to 560 – 600 USD in future. However, that is the end of my optimism.
I will consider these levels as a potential possibility to look for longs.
Unfortunately, in a longer term, Ethereum still remains in the bearish zone and retains the potential for the further decrease, for now, I think the low to be at the level of about 200 USD.
Fibonacci time zones help us to figure out, how long all this nightmare will go on. Fibonacci timing suggests the decreasing cycle should continue through early May.
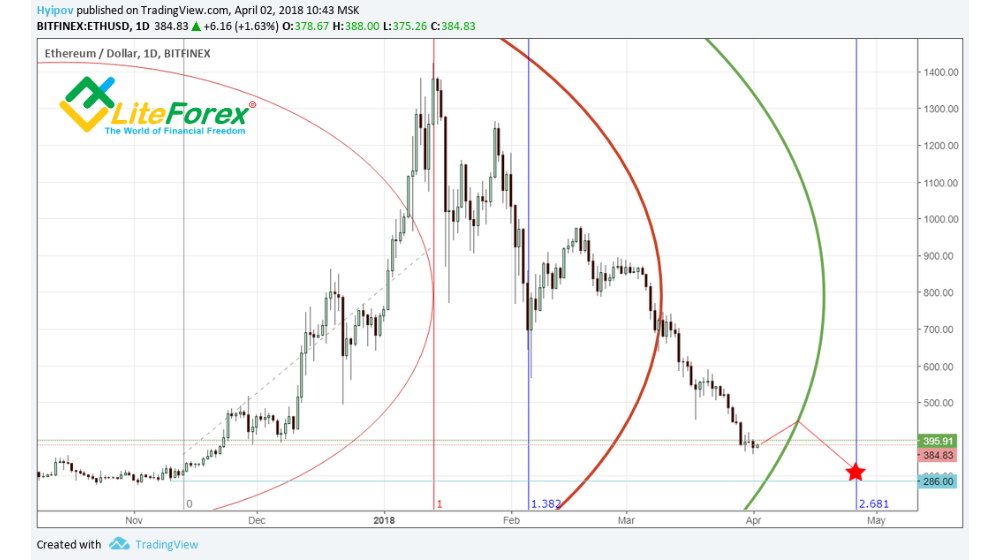
Therefore, in general, the trading scenario for today, especially for risky traders, looks like this: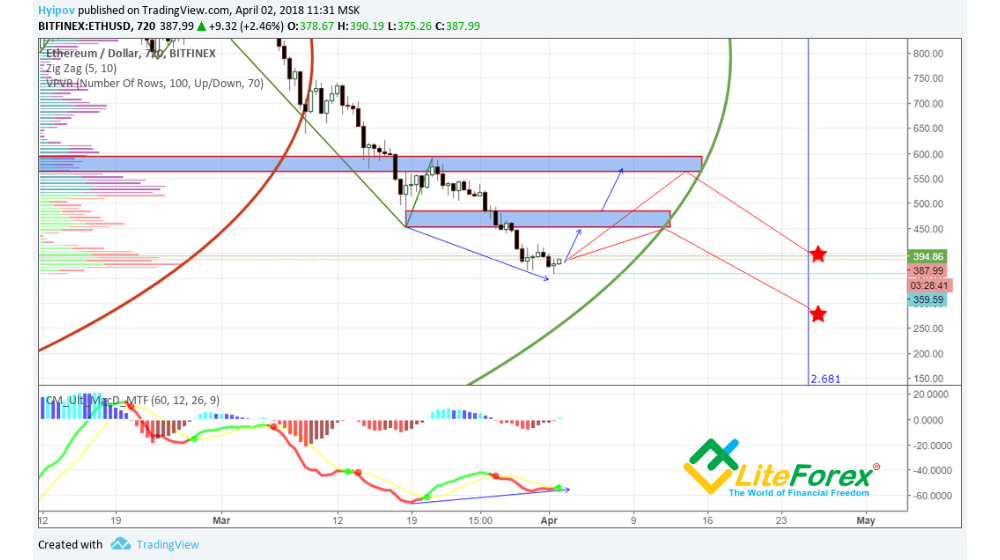
BUY in 380 - 390 USD with the target to catch the rebound
Max 10% of the deposit
SL below 350 USD
TP 1 – 450 USD
TP 2 – 560 USD
