Bitcoin is a good guy! It’s accurately following the predicted route and has already passed through all the key points, suggested for the periodAttention! In this post the following types of analysis are applied: indicators, graphic analysis, Fibonacci levels, fractal analysis and trading volume analysis.
Dear friends,
I go on reading the charts and trying to predict our old Bitcoin’s future.
Let’s look at the last forecast. We see that Bitcoin was obediently moving within the suggested trend lines.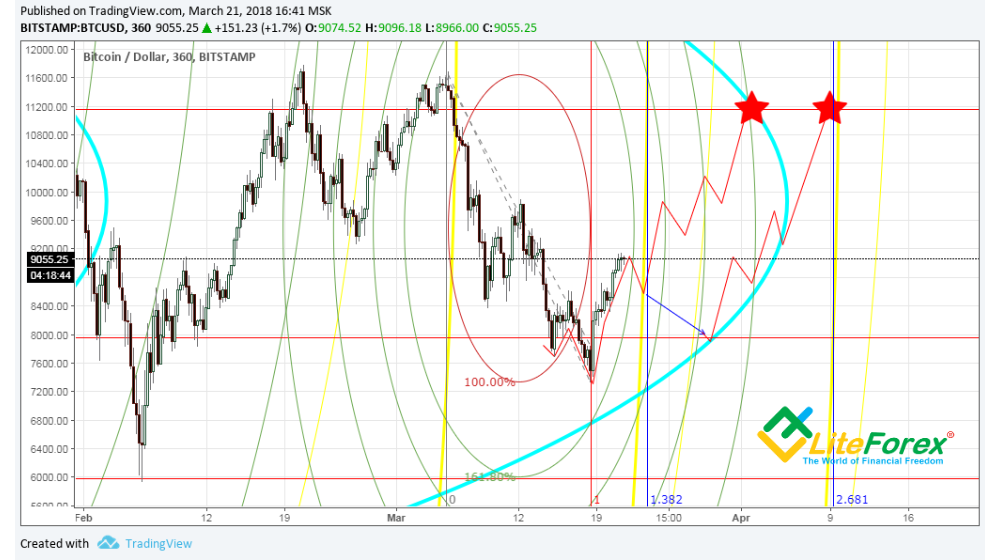
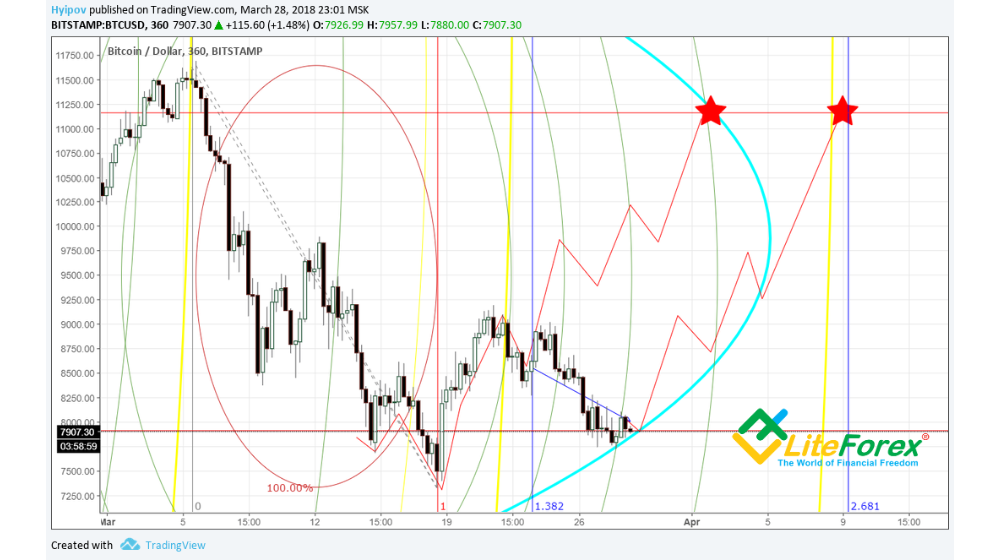
According to my previous forecast, the turquoise Fibonacci ark, drawn from the multi-year trend, starting in 2015 and ending in late 2017, has strong magnetic properties and is really able to reverse trends.
However, because it is drawn in the large-scale chart, weekly timeframe, the error of the resistance zone is rather significant.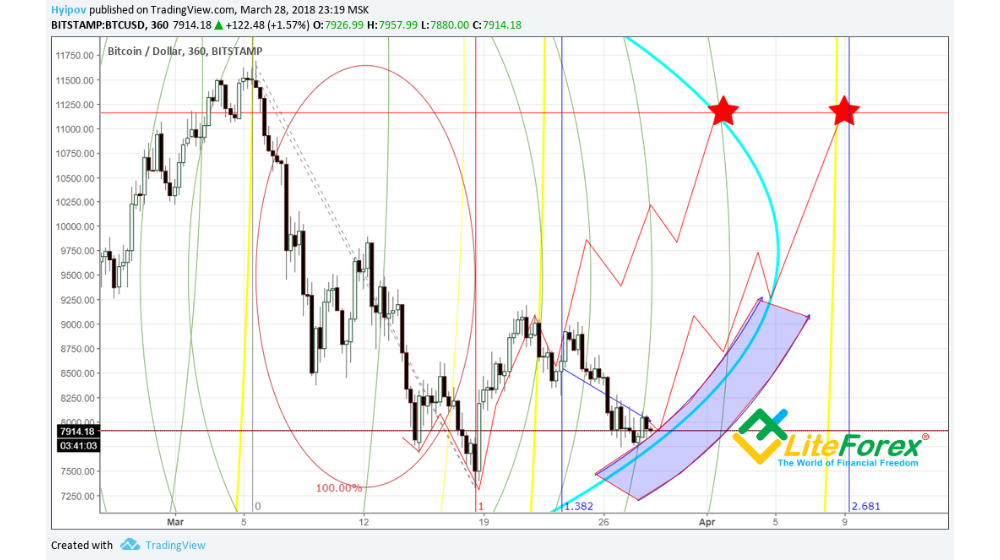
I marked with blue colour the assumed resistance zone that, as you see, is rather wide and allows BTC to dive as deeply as to 7 250 USD.
This conclusion is based on my observation of the price moves at this arc’s level in the past.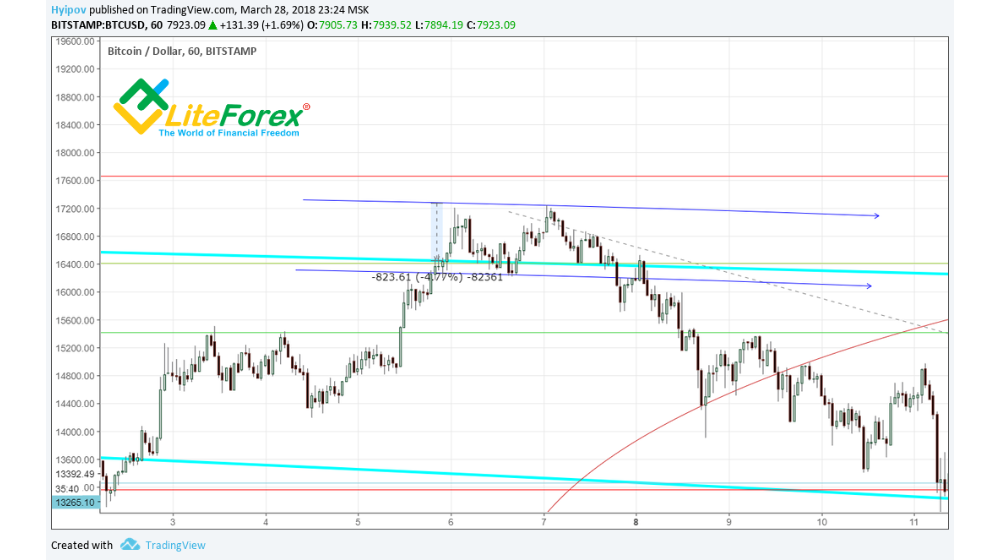
As it is clear from the chart above, false penetrations of this zone can be as deep as 800 USD, so the resistance zone of 500 USD in size is more than optimistic
The only thing, we know for sure, the trend will reverse soon.
An additional sign of the reversal is harmonic pattern Butterfly, which has almost formed.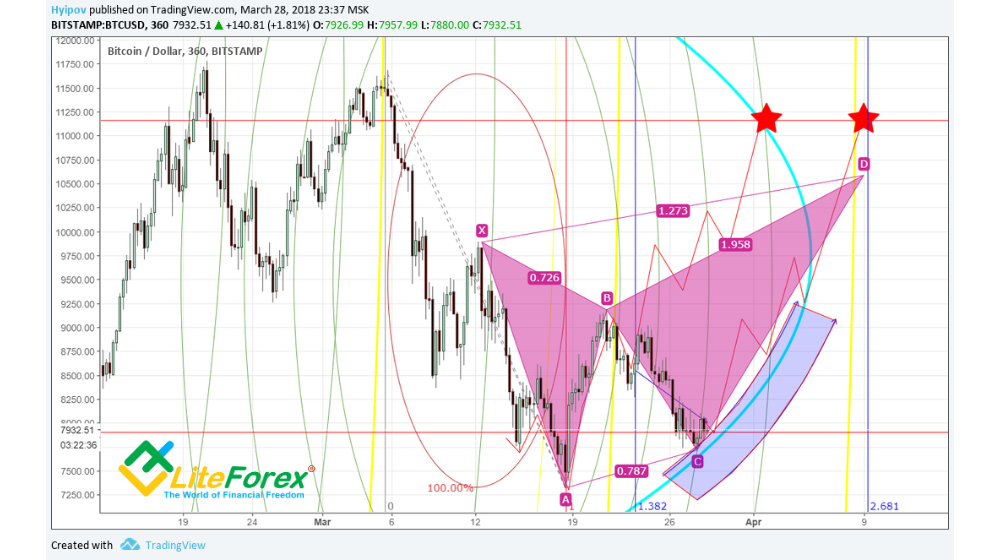
Targets, according to this pattern, are in the price range between 10 000 and 11 000 USD.
I made another interesting discovery when I was scanning volumes for short and long positions, the information provided by Bitfinex.
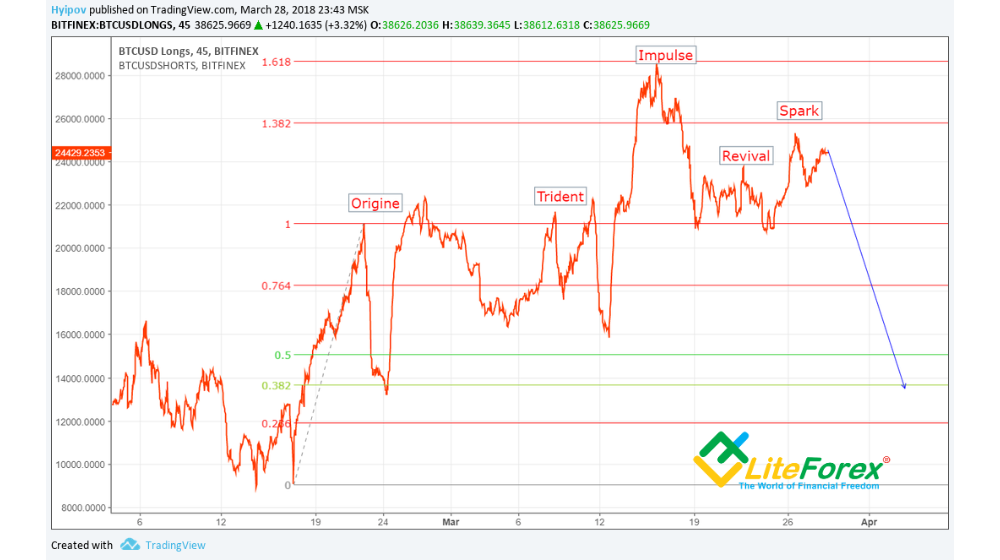
In 30-minute chart, I has clearly seen that a bullish fractal model is finishing to form in the chart BTC/USD SHORTS (see below). It means, we can expect a strong rollback before a new model starts to form.
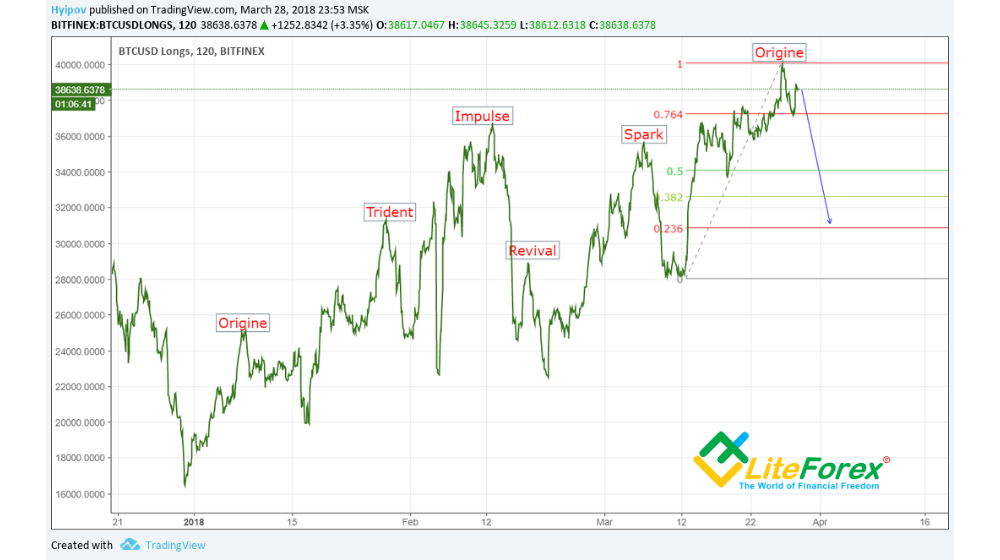
BTCUSDLONGS situation looks far more optimistic. According to the peaks, formed in the past, now buyers witness the start of a new bullish fractal model, they are at the peak of Origin element.
Before the price moves on, it will naturally go down, which coincides with possible sellers’ behaviour.
Decrease in the volumes for short and long positions means only one thing – uncertainty in the market, so the trend is likely to move sideways with trading inside a small channel.
Such situation can’t continue for a long time.
If we look at a larger scale, we will see an emerging triangle
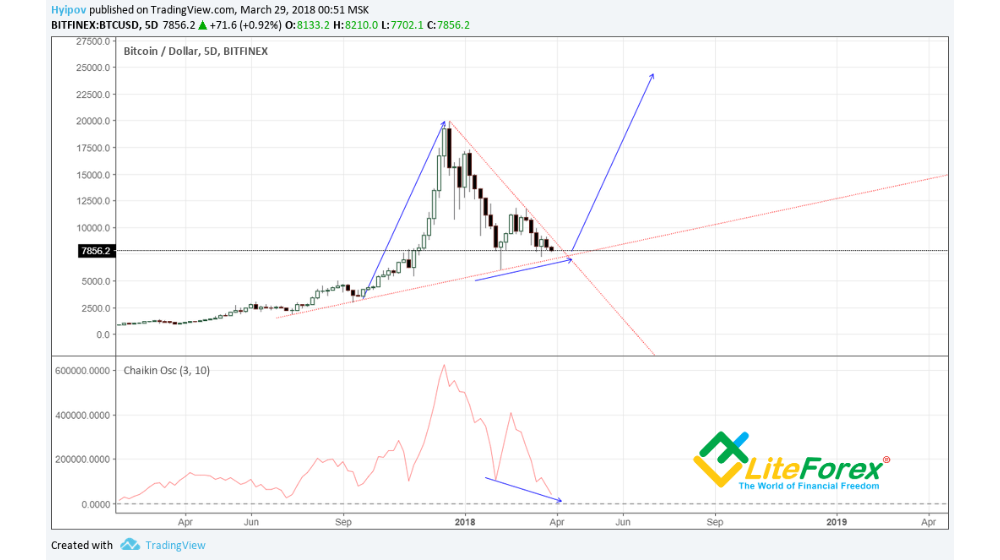
We also see a well-formed hidden bullish divergence in Chaikin oscillator, it also suggests the triangle breakout from below.
If we accept this suggestion, the breakout target will be equal to the triangle base, locating at the level of about 25 000 USD.
Finally, let’s study the volumes.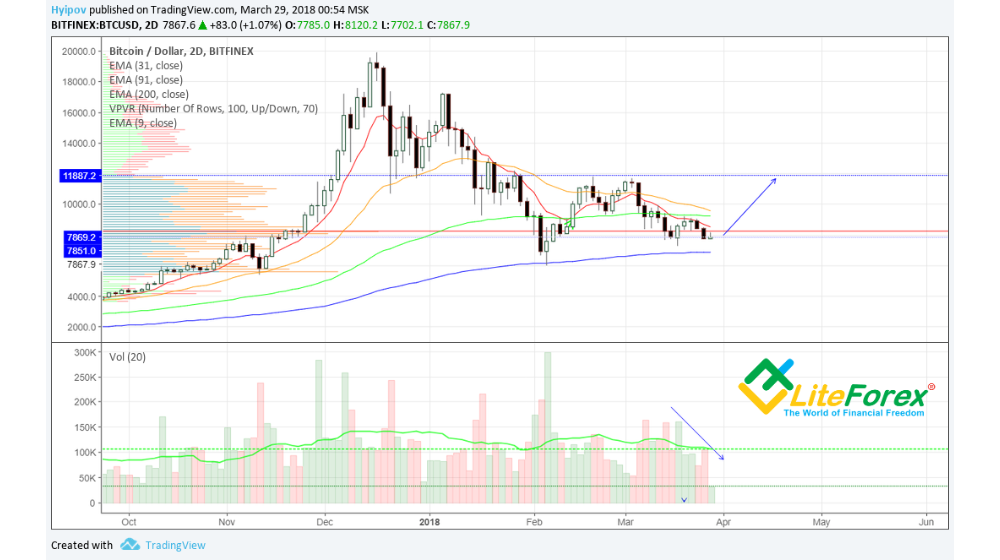
As it is seen in the chart above, the ticker has a strong support from EMA200. Considering the fact that the volume has been decreasing for the recent days, I don’t think that the market will be strong enough to break out the level of this moving, which is at about 6 900 USD.
Vertical volume indicates strong traded channel in the range of 7 900 – 11 900 USD.
For now, the price is at the channel lower border. Considering all the above, it is far easier for the market to move towards the upper channel border than to go downwards.
Are you sure that no manipulator will have enough resources to do it???
What’s in the end?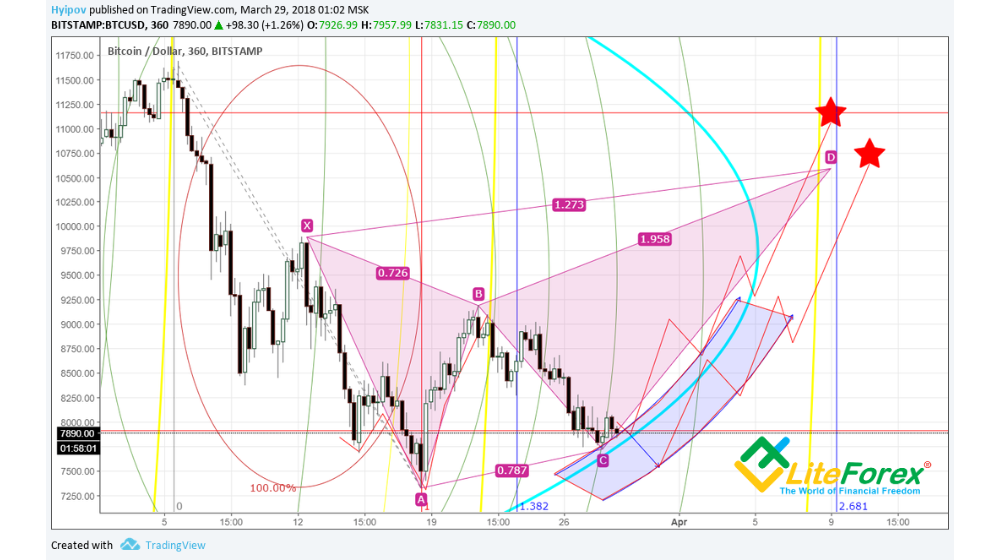
Bad for margin traders, good for hodlers, but Bitcoin will hardly reach the levels of 4 000 USD and lower in the near future.
