
Analog Devices Inc. (NASDAQ:ADI) delivered first-quarter fiscal 2019 adjusted earnings of $1.33 per share, beating the Zacks Consensus Estimate by 5 cents. However, the bottom line decreased 10.7% year over year and 14.2% sequentially.
Revenues of $1.54 billion topped the consensus mark of $1.51 billion. However, the top line declined 2% year over year and 3.7% from the previous quarter.
This can be attributed to weak performance of the company in consumer, industrial and automotive end markets during the reported quarter. Moreover, macroeconomic headwinds also impacted the top line negatively.
Nevertheless, the company’s solid momentum in the communications market remained positive. Further, its strengthening relationships with customers and expanding addressable market size are expected to continue aiding business growth.
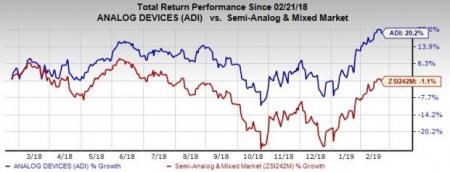
Coming to share price performance, shares of Analog Devices have returned 20.2% over a year against the industry’s decline of 1.1%.
Revenues by End Markets
Industrial: The company generated $728.1 million revenues (47% of total revenues), declining 6.8% year over year.
Communications: Revenues from this market came in $345.2 million (22% of revenues), increasing 34.1% year over year. This can primarily be attributed to rising 5G deployments and upgradation in 4G technology.
Automotive: Revenues from this market came in $259.5 million (17% of revenues), decreasing 1.6% from the year-ago quarter.
Consumer: This market generated $208.3 million revenues (14% of revenues), dropping significantly 21% on a year-over-year basis.
Analog Devices, Inc. Price, Consensus and EPS Surprise
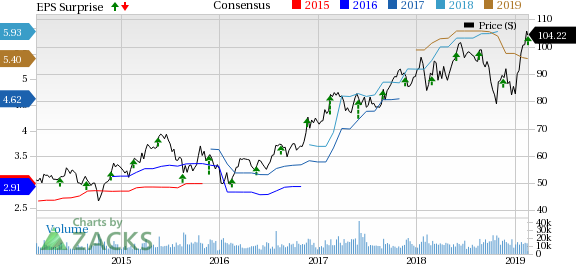
Analog Devices, Inc. Price, Consensus and EPS Surprise | Analog Devices, Inc. Quote
Operating Details
Non-GAAP gross margin contracted 90 basis points (bps) on a year-over-year basis to 70.3%.
Adjusted operating expenses, as a percentage of revenues came in 29.1%, expanding 60 bps from the year-ago quarter.
Non-GAAP operating margin contracted 150 bps on a year-over-year basis to 41.2% during the reported quarter.
Balance Sheet & Cash Flow
As of Feb 2, 2019, cash and cash equivalents were $605.9 million, down from $816.6 million as of Nov 3, 2018.
Long-term debt was approximately $6.23 billion, declining from $6.27 billion at fiscal fourth quarter-end.
Net cash provided by operations was $371.8 million, down from $714.4 million in the previous quarter.
Further, the company generated $280.8 million of free cash flow during the first quarter.
In addition, Analog Devices returned $400 million to its shareholders through dividends and share repurchases.
Guidance
For the second-quarter of fiscal 2019, Analog Devices expects revenues to be $1.50 billion (+/- $50 million). The Zacks Consensus Estimate for the same is pegged at $1.52 billion.
Non-GAAP earnings are expected to be $1.30 (+/- $0.07) per share. The consensus mark for the same is pegged at $1.31 per share.
Further, the company anticipates non-GAAP operating margins to be approximately 41.3%.
Zacks Rank and Stocks to Consider
Analog Devices carries a Zacks Rank #3 (Hold).
Some better-ranked stocks in the broader technology sector are Benefitfocus, Inc. (NASDAQ:BNFT) , Square, Inc. (NYSE:SQ) and Etsy, Inc. (NASDAQ:ETSY) . While Benefitfocus sports a Zacks Rank #1 (Strong Buy), Square and Etsy carry a Zacks Rank #2 (Buy). You can see the complete list of today’s Zacks #1 Rank stocks here.
Long-term earnings growth rate for Benefitfocus, Square and Etsy is currently pegged at 25%, 25% and 15%, respectively.
Zacks' Top 10 Stocks for 2019
In addition to the stocks discussed above, would you like to know about our 10 finest buy-and-holds for the year?
Who wouldn't? Our annual Top 10s have beaten the market with amazing regularity. In 2018, while the market dropped -5.2%, the portfolio scored well into double-digits overall with individual stocks rising as high as +61.5%. And from 2012-2017, while the market boomed +126.3, Zacks' Top 10s reached an even more sensational +181.9%.
See Latest Stocks Today >>
Etsy, Inc. (ETSY): Free Stock Analysis Report
Benefitfocus, Inc. (BNFT): Free Stock Analysis Report
Square, Inc. (SQ): Free Stock Analysis Report
Analog Devices, Inc. (ADI): Free Stock Analysis Report
Original post
Zacks Investment Research