
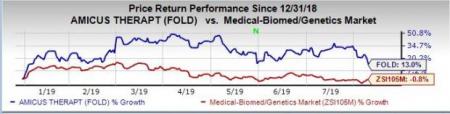
Shares of Amicus Therapeutics, Inc. (NASDAQ:FOLD) have declined almost 8.5% since its earnings release on Thursday Aug 8. However, the stock has rallied 13% so far this year versus the industry’s decrease of 0.8%.
Amicus reported loss of 34 cents per share in the second quarter of 2019 (excluding loss due to exchange of convertible notes), in line with the Zacks Consensus Estimate but wider than the year-ago loss of 33 cents.
Total revenues in the reported quarter were $44.1 million, skyrocketing almost 107% from $21.3 million in the year-ago quarter. The figure also surpassed the Zacks Consensus Estimate of $41 million. The company realized revenues from the commercial sales of its only marketed drug Galafold (migalastat).
Sales of Galafold surged 30% sequentially, largely driven by new patients in the second quarter along with higher-than-anticipated prescriptions in the EU, Japan and the United States.
Galafold won an accelerated nod from the FDA last August for the treatment of adults with a confirmed diagnosis of Fabry disease and an amenable galactosidase alpha gene (GLA) variant.
Earlier this month, Amicus received a marketing approval for Galafold in Argentina. The company is preparing to launch the drug in the first-ever Latin American market, which should drive global sales.
2019 Guidance
For 2019, Amicus expects Galafold to generate revenues of $160-$180 million with more than 1,000 Fabry patients by the end of this year. The view is unchanged from the previous estimate. Consistent with Galafold’s adoption trends and ordering patterns seen in the past years, Amicus expects flat-to-moderate revenue growth in the third quarter and higher revenue growth in the fourth.
Expectation for insignificant growth in Galafold sales during the third quarter after an impressive second-quarter sequential sales growth probably hurt investor sentiments and prompted the share price decline.
The company expects to end 2019 with approximately $400 million of cash in hand. The current cash position is anticipated to be enough to fund the ongoing operations through 2021.
Pipeline Update
The lead pipeline candidate in Amicus’ portfolio is AT-GAA, a differentiated biologic for Pompe disease. The company expects to complete enrollment in pivotal PROPEL study on AT-GAA for Pompe disease by 2019 end.
Amicus has two gene-therapy programs in pipeline for two different types of Batten disease. Earlier this month, the company announced positive interim results from the phase I/II study on its CLN6 Batten disease gene therapy program. In it, the candidate showed a positive impact on motor and language function in seven of eight patients compared with a natural history dataset as well as in comparisons to sibling pairs.
Meanwhile, Amicus expects to complete enrollment in the ongoing CLN3 Batten disease phase I/II study by this year-end. The company also plans to achieve preclinical proof of concept for Fabry and Pompe gene therapies in 2019.
Additionally, Amicus entered into an agreement with Ultragenyx (NASDAQ:RARE) to in-license exclusive Japanese rights to the latter's Mepsevii for Mucopolysaccharidosis type VII (MPS VII) syndrome, a rare lysosomal disorder in Japan. The company plans to use the existing Mepsevii data package and results from an ongoing study to submit a regulatory filing in Japan.
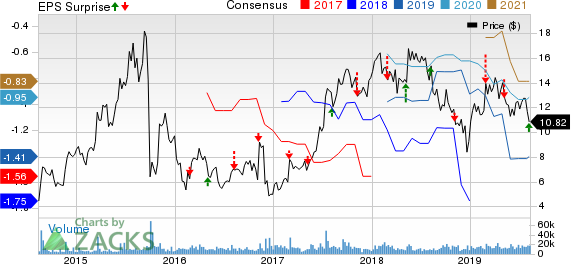
Amicus Therapeutics, Inc. Price, Consensus and EPS Surprise
Zacks Rank & Stocks to Consider
Amicus currently has a Zacks Rank #2 (Buy). Some other top-ranked stocks in the healthcare sector are BeiGene, Ltd. (NASDAQ:BGNE) and Unum Therapeutics Inc. (NASDAQ:UMRX) , both sporting a Zacks Rank #1 (Strong Buy). You can see the complete list of today’s Zacks #1 Rank stocks here.
BeiGene’s loss per share estimates have been narrowed 2.7% for 2019 and 2.2% for 2020 over the past 60 days.
Unum Therapeutics’ loss per share estimates have been narrowed 3.7% for 2019 and 7.4% for 2020 over the past 60 days.
Today's Best Stocks from Zacks
Would you like to see the updated picks from our best market-beating strategies? From 2017 through 2018, while the S&P 500 gained +15.8%, five of our screens returned +38.0%, +61.3%, +61.6%, +68.1%, and +98.3%.
This outperformance has not just been a recent phenomenon. From 2000 – 2018, while the S&P averaged +4.8% per year, our top strategies averaged up to +56.2% per year.
See their latest picks free >>
BeiGene, Ltd. (BGNE): Free Stock Analysis Report
Ultragenyx Pharmaceutical Inc. (RARE): Free Stock Analysis Report
Amicus Therapeutics, Inc. (FOLD): Free Stock Analysis Report
Unum Therapeutics Inc. (UMRX): Free Stock Analysis Report
Original post
Zacks Investment Research