
American Capital Agency Corp. (NASDAQ:AGNC) reported second-quarter 2016 net spread and dollar roll income of 56 cents per share (excluding estimated "catch-up" premium amortization benefit) that beat the Zacks Consensus Estimate of 51 cents. The reported figure also came higher than 52 cents earned in the prior quarter.
Second-quarter 2016 comprehensive income per common share was 73 cents as against comprehensive income per share of 1 cent recorded in the prior quarter.
The economic return on equity for the company during the quarter was a positive 3.3%. This reflected dividend per share of 60 cents and a 13 cents rise in net book value per share.
The company’s annualized economic income on common equity was 13.3% as against economic income of 1.8% in the prior quarter. Moreover, as of Jun 30, 2016, the company’s net book value per share was $22.22, up from $22.09 as of Mar 31, 2016. This rise was attributed to a modest increase in spreads between the yield on agency mortgage backed securities (“MBS”) and benchmark interest rate.
Notably, net interest income (“NII”) of $217 million missed the Zacks Consensus Estimate of $232 million. However, it came in higher than the prior-quarter figure of $196 million.
Inside the Headlines
As of Jun 30, 2016, the company’s investment portfolio aggregated $61.5 billion of agency MBS, to-be-announced (TBA) securities and AAA non-agency MBS. This included $7.1 billion of TBA mortgage position and $0.1 billion of AAA non-agency MBS.
Inclusive of its net TBA position, American Capital Agency’s "at risk" leverage ratio was 7.2x as of Jun 30, 2016, down from prior-quarter figure of 7.3x. For the second quarter, the company’s investment portfolio bore a weighted-average constant repayment rate of 11.8% compared with 8.8% in the prior quarter.
Average asset yield on its "balance sheet funded assets" (investment portfolio exclusive of net TBA position) was 2.46% for the second quarter, up from 2.32% in the prior quarter. Moreover, combined annualized net interest rate spread on the company’s balance sheet and dollar roll funded assets for the quarter was 1.16% compared with 0.94% in the prior quarter.
Also, as of Jun 30, 2016, American Capital Agency’s cash and cash equivalents totaled around $1.13 billion, up from $1.11 as on Mar 31, 2016.
Dividend Update
In second-quarter 2016, American Capital Agency declared monthly dividends of 20 cents per share for April, May and June. Notably, the company disbursed a total of $6.4 billion in common dividends or $33.90 per common share, since its initial public offering in May 2008.
Conclusion
We expect American Capital Agency to remain range-bound in the near term, given the current market volatility. However, the rise in book value is encouraging. The company’s concerted measures to reposition its portfolio for meeting the current rate environment are expected to help it sail through the difficult times.
AMER CAP AGENCY Price, Consensus and EPS Surprise
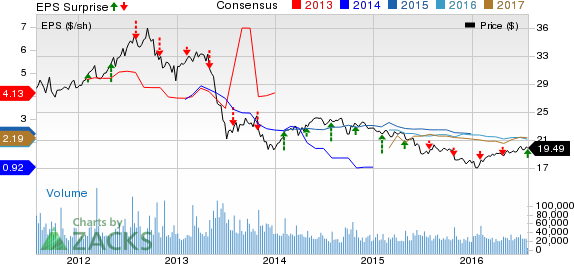
AMER CAP AGENCY Price, Consensus and EPS Surprise | AMER CAP AGENCY Quote
American Capital Agency currently has a Zacks Rank #3 (Hold).
Investors interested in the mREIT industry may consider stocks like Chimera Investment Corporation (NYSE:CIM) , Great Ajax Corp (NYSE:AJX) and Redwood Trust, Inc. (NYSE:RWT) . All these stocks sport a Zacks Rank #1 (Strong Buy).
AMER CAP AGENCY (AGNC): Free Stock Analysis Report
REDWOOD TRUST (RWT): Free Stock Analysis Report
CHIMERA INVEST (CIM): Free Stock Analysis Report
GREAT AJAX CORP (AJX): Free Stock Analysis Report
Original post
Zacks Investment Research