
American Airlines Group Inc.’s (NASDAQ:AAL) first-quarter 2017 earnings (adjusted) of 61 cents per share beat the Zacks Consensus Estimate by 4 cents.
Quarterly earnings decreased significantly year over year due to higher costs, which displeased the investors. Consequently, shares of the company were down in early trading.
Revenues of $9,624 million were 2% above the year-ago figure. Quarterly revenues edged past the Zacks Consensus Estimate of $9,621.3 million. Total revenue per available seat miles (TRASM) improved 3.1% to 14.96 cents in the reported quarter. In fact, this quarter marked the second successive one in which the metric grew on a year-over-year basis, since the fourth quarter of 2014.
Consolidated yield improved 2.4% to 16 cents. Passenger revenue per available seat miles improved 2% to 12.67 cents. Traffic was down 1.5%, whereas capacity was down 1.1%. This resulted in relatively empty planes. Consolidated load factor (percentage of seats filled by passengers) declined as traffic contraction was more than the capacity decline. Load factor deteriorated to 79.2% from the comparable year-ago figure of 79.6%.
Total operating expenses climbed 11.4% year over year to $9 billion primarily due to the rise in fuel costs. Expenses pertaining to salaries and benefits were up 6.5%. Consolidated operating costs per available seat miles (CASM: excluding special items) increased 7.6%. Average fuel price (including taxes) increased 40.4% to $1.7 per gallon.
During the quarter, this Zacks Rank # 3 (Hold) company returned $563 million billion to its shareholders through the payment of $51 million in dividends and buyback of shares worth $512 million. Furthermore, the carrier also declared a dividend of 10 cents per share.
The dividend will be paid on May 30, to the shareholders on May 16. The carrier has returned more than $10.2 billion to stockholders through share repurchases and dividends since mid-2014. We are impressed by the company’s efforts to reward shareholders through stock repurchases and dividend payments.
You can see the complete list of today’s Zacks #1 Rank (Strong Buy) stocks here.
Notably, American Airlines announced the increase in hourly base pay for its crew members (outside of contract negotiations). Additionally, it remains focused on introducing new aircraft and retiring old ones from its fleet. In fact, keeping in with its aim to modernize its fleet, the carrier took delivery of 17 new mainline aircraft and five regional ones during the first quarter of 2017.
Also, the company invested $1.2 billion toward a new aircraft during the quarter. Moving ahead, it aims to shell out $4.1 billion in 2017 for the same purpose.
American Airlines Group, Inc. Price, Consensus and EPS Surprise
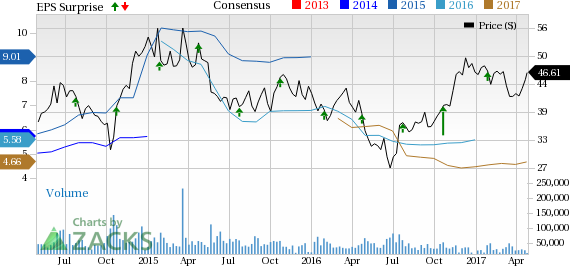
American Airlines Group, Inc. Price, Consensus and EPS Surprise | American Airlines Group, Inc. Quote
Outlook
Total revenue per available seat miles (TRASM) is expected to increase in the band of 3% to 5% in the second quarter of 2017 on a year-over-year basis. Pre-tax margin excluding special items is projected in the range of 11% to 13%. Consolidated CASM (excluding special itemsand fuel) for the second quarter is projected to increase 7%. The metric is expected to increase approximately 5% in 2017. Capacity (system) in 2017 is projected to increase 1.5% in 2017.
Other Key Releases Coming Up
Investors interested in the broader transportation space keenly await the first-quarter earnings reports of Spirit Airlines (NASDAQ:SAVE) , Copa Holdings (NYSE:CPA) and Air Lease Corp. (NYSE:AL) , slated to be released on Apr 28, May 10 and May 4, respectively.
The Best & Worst of Zacks
Today you are invited to download the full, up-to-the-minute list of 220 Zacks Rank #1 "Strong Buys" free of charge. From 1988 through 2015 this list has averaged a stellar gain of +25% per year. Plus, you may download 220 Zacks Rank #5 "Strong Sells." Even though this list holds many stocks that seem to be solid, it has historically performed 6X worse than the market. See these critical buys and sells free >>
Copa Holdings, S.A. (CPA): Free Stock Analysis Report
Spirit Airlines, Inc. (SAVE): Free Stock Analysis Report
American Airlines Group, Inc. (AAL): Free Stock Analysis Report
Air Lease Corporation (AL): Free Stock Analysis Report
Original post
Zacks Investment Research