Bitcoin’s dominance is at the highest level for the past 2,5 years. With 67% market dominance, Bitcoin plays a superior role and is more than twice as dominant as during Bitcoin’s ATH in January 2018.
But every trend has its swings and even this dominance will not just steadily increase. In fact, there could be a downtrend for Bitcoin’s dominance around the corner, which would, in turn, result in a massive altcoin run.
To find out which altcoins may have excellent chances to outperform Bitcoin in 2020, we look at the technical analysis of several cryptocurrencies.
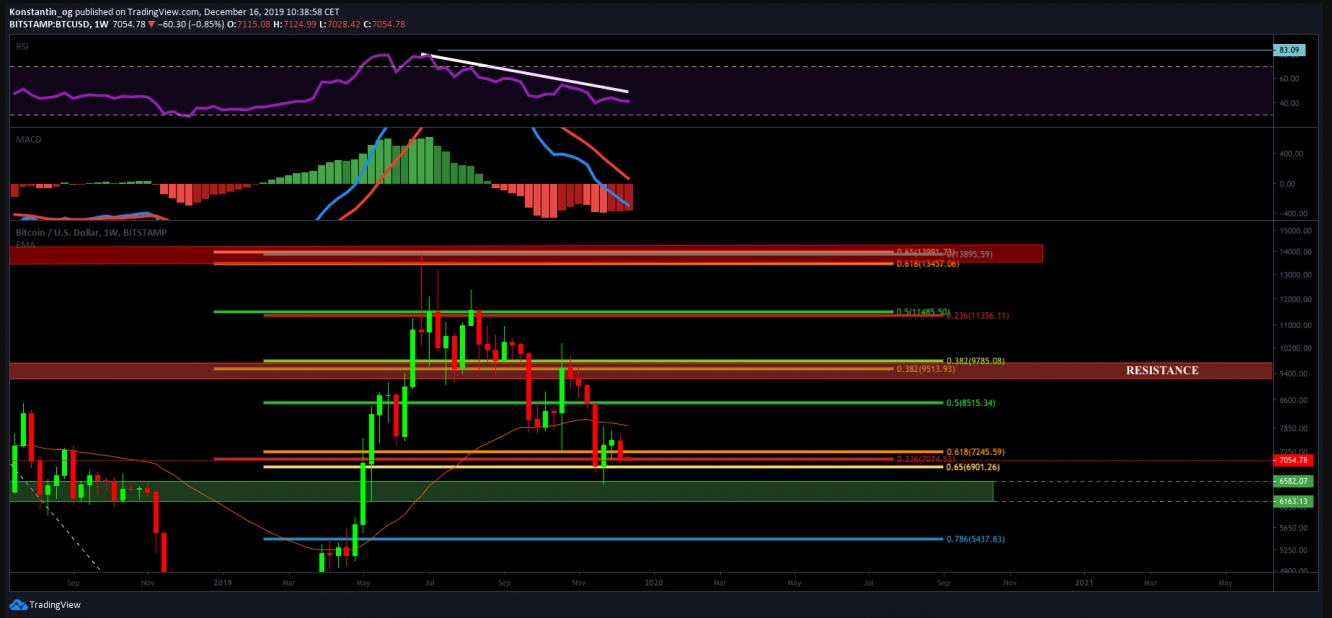
Bitcoin is in the golden ratio support zone and while the MACD’s histogram is ticking bullishly higher, the RSI is trending down. It seems likely that Bitcoin will either bounce off this support zone very soon or reach down to its previous support zone at $6,500 and bounce there. Thus, Bitcoin has a little bit more downside potential in the short-term, but decent upwards potential in the mid-term.
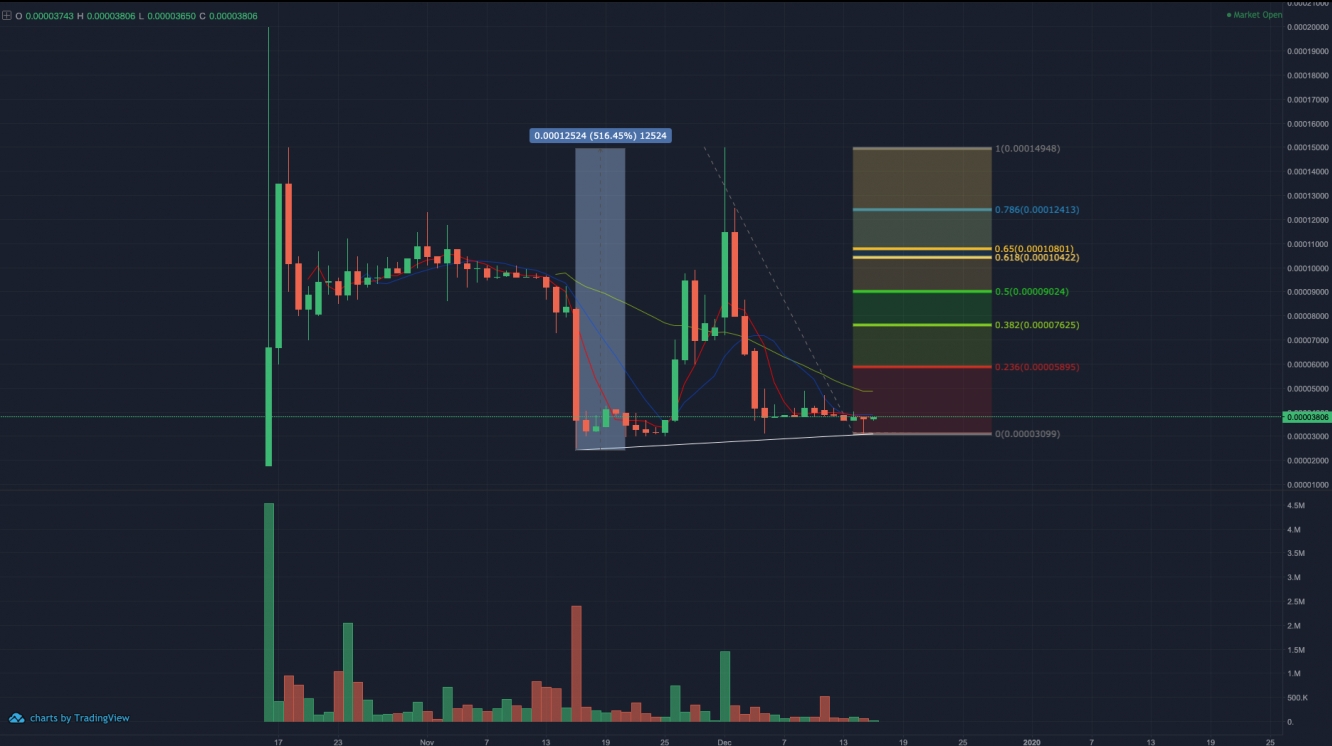
The QURAS Coin, XQC, recently surged by more than 500 percent but has retraced notably since then. The current price development looks like a floor building, as the low price levels continue to go sideways. If QURAS goes for another uptrend, it could surge as high as $0.000108 where the golden ratio acts as significant resistance.
With QURAS’ mainnet coming live in February 2020, QURAS could become the leading authority to enable users and enterprises to choose whether their transactions will be public, partially private, or completely private. Thanks to these privacy features, the QURAS protocol can adopt regulatory compliance along with and real-world use cases that require verifiable identification. This privacy and anonymity are provided by two leading privacy technologies, Zero-Knowledge Proof and Ring Signature.
Currently, XQC is live and trading on three digital asset exchanges currently; Bithumb Global, BiKi and CoinTiger.
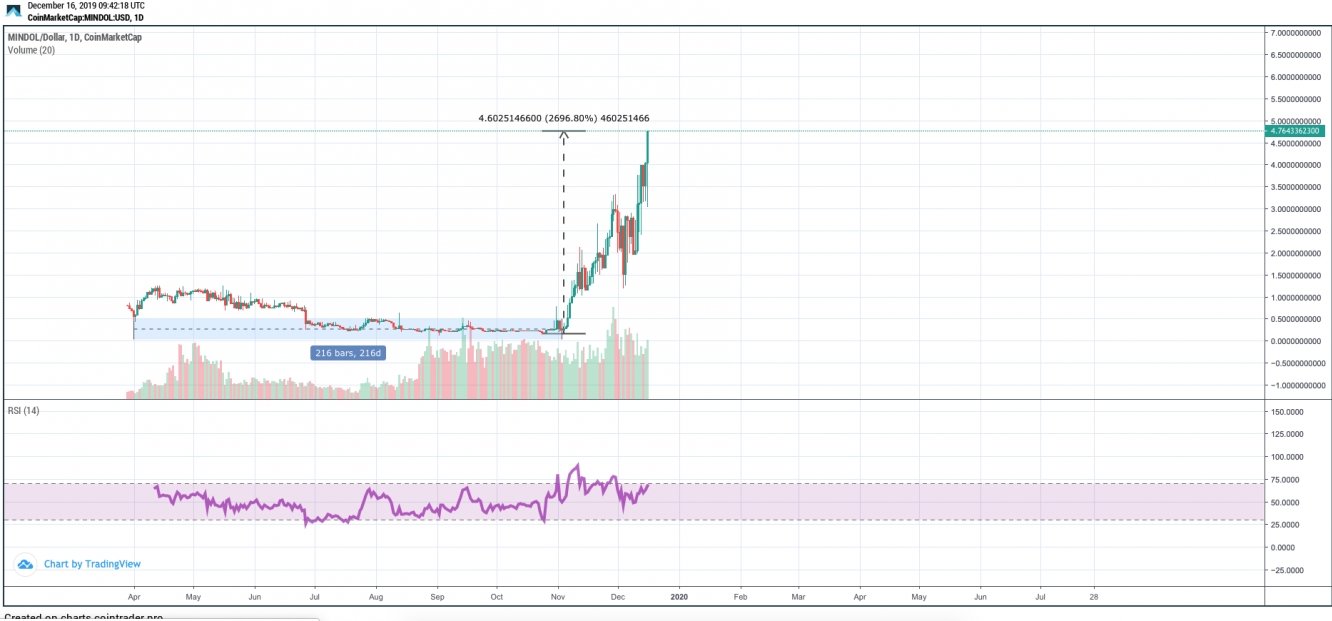
Mindol was in a massive downtrend for more than 200 days. However, just recently the volume spiked high and the price even higher, surging by nearly 2700%.
MINDOL is ready to reform the Japanese entertainment industry on the Internet and establish a marketplace of “eMINDOL” that provides functions of posting, voting, donation, settlement, and copyright management. It also develops a project of content creation including animation, game and film productions.
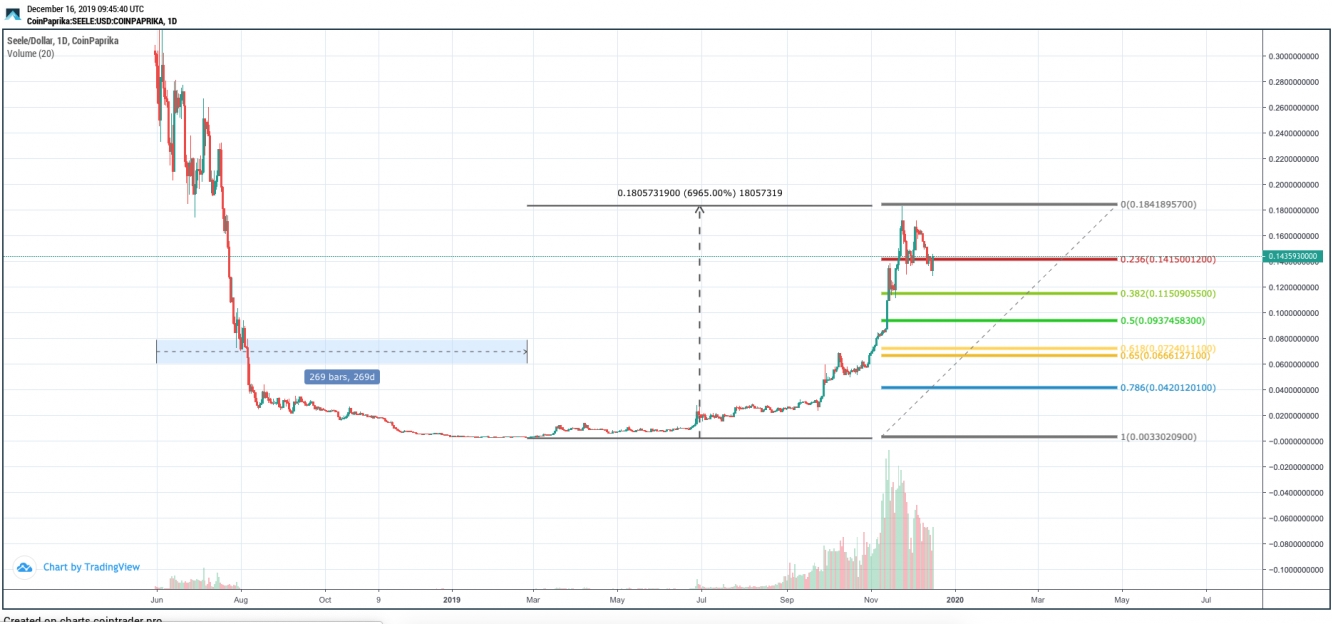
Seele was trending down for nearly 270 days and gained traction during March 2019. Since then, it surged by an incredible 6965% percent, peaking at $0.184. With a massive increase in volume the past two months, Seele seems to have initiated a correction wave. For now, Seele will most likely retrace down to the 0.382 fib level at $0.115.
Seele is a promising candidate to offer sharding solutions due to its anti-asic MPoW algorithm. Seele’s sharding technology is built for high throughput concurrency with 2000 TPS in the Seele mainnet, which is currently only a starting point and highly scalable as demand increases.
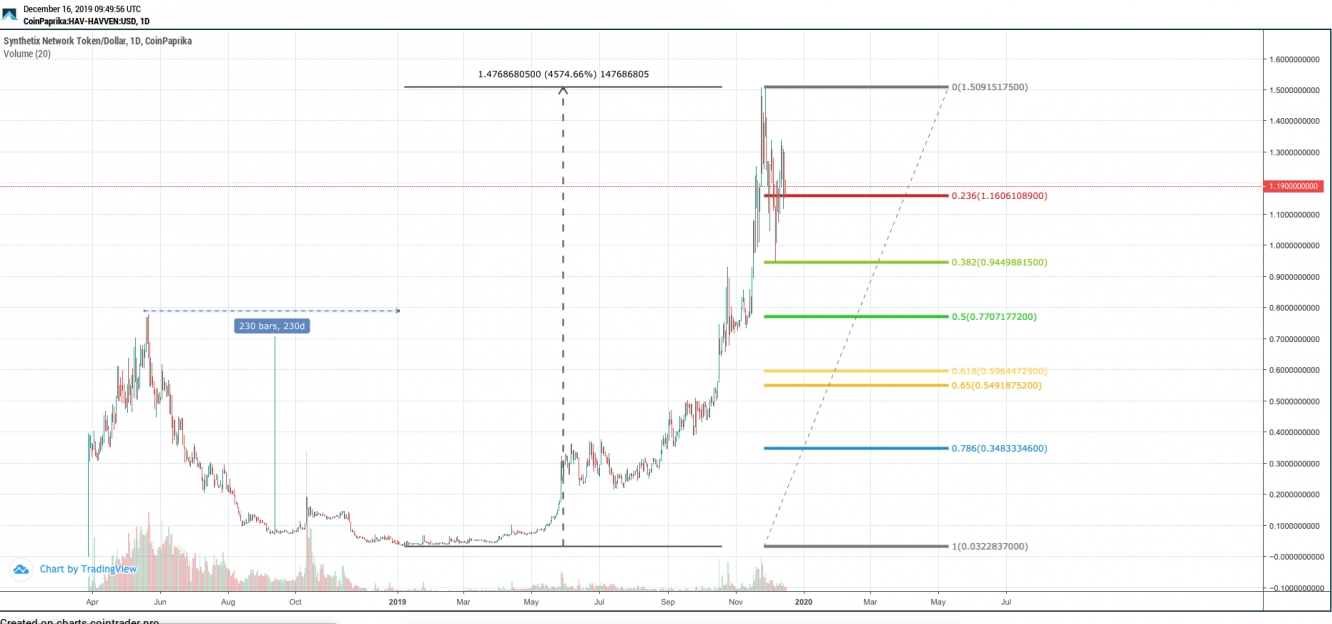
SNX, formerly HAVVEN, also trended down for a very long time, with 230 red until it formed some sort of a bottom. Since then, however, it surged nearly 4600% and peaked at $1.50. Although it recently bounced off the 0.382 fib level at $0.945, it seems that it will continue its retracement for now. It could reach down to the golden ratio at $0.6 where it could initiate another decent uptrend.
SNX is the first solution to offer synthetic assets, which can be traded on its own exchange, Synthetix. The generated fees are distributed to token holders that lock their tokens to the system (stake).
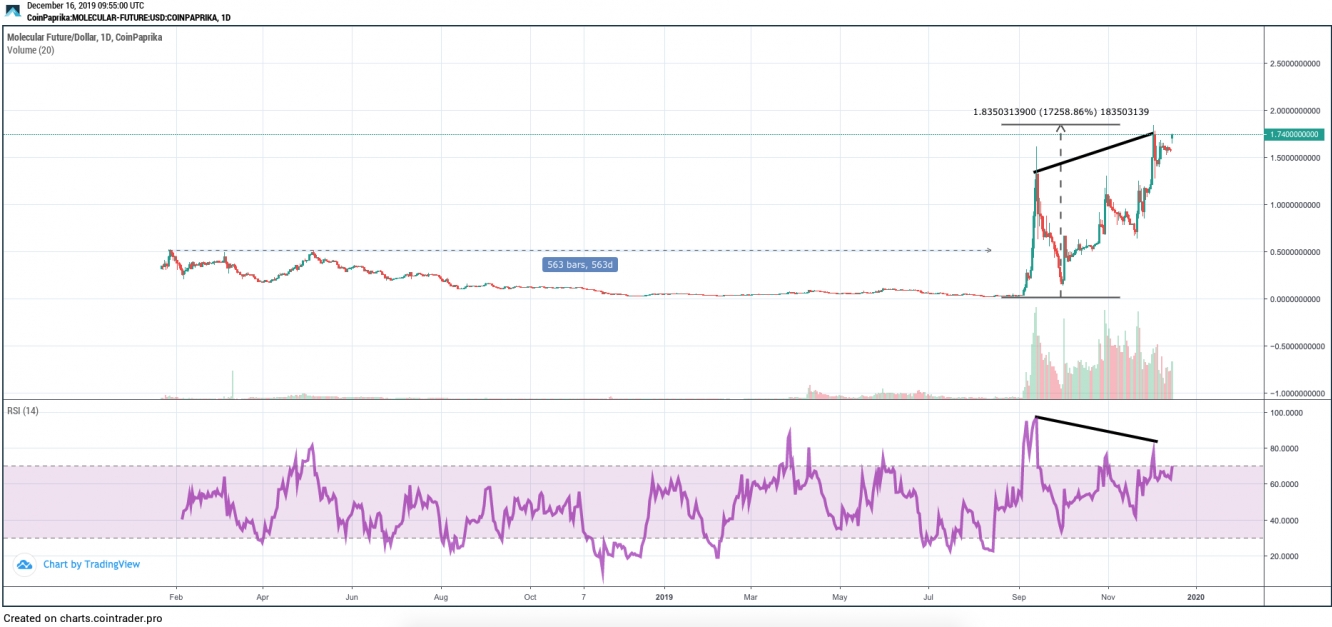
Molecular Future even trended down for 1.5 years, with 563 of red days. But just recently, during September 2019, it began to trend towards the upside. Since then, it surged by an unbelievable 17258% and formed a new ATH around $1.80. For now, the bearish divergence in the RSI hints at a correction.
Molecular Future enables one-click investment in diversified digital assets, including but not limited to various types of digital currencies, digital currency hedging, digital currency arbitrage, digital currency crowdfunding, and digital currency quantitative trading. Molecular Future is backed by large industry giants such as Molecular Group, Eagle Fund, Hong Kong Capital Fund, XBTING Foundation, HCASH Foundation and Science Bank Capital.
