
The cryptocurrency market looks oversold - but as we examine the charts we find healthy signs of life despite the pessimistic mainstream media narrative. With that's we take a look at a reason to be cheerful, so we stop for a moment to consider the Maker project, which has defied the market over the last 24 hours.
Altcoin Trading Volume Offers Hope
Let’s face facts - it’s been a horrible week for all of us who care about crypto. Even some long-term investors are calling it quits and selling at a loss.
But here at the Crypto Briefing, we do like to focus on some of the positive signals when we can.
So let’s take a look at trading volume for altcoins.
We have to go back to September 2017 to see a market cap for altcoins this low. Back then, 24-hour trading volume was two or three billion dollars per day.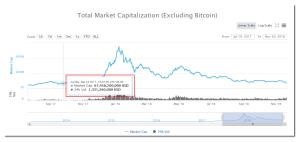
Altcoin Trading Volume September 2017
As the 2017 bubble inflated, volume spiked at forty-five billion dollars per day - and, as expected, volume decreased dramatically as prices fell. But it never fell to a couple of billion per day.
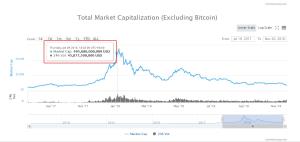
Altcoin trading volume after crypto bubble burst
Now, trading volume is ten to fifteen billion dollars per day - and in the long-term, a consistently strong volume is almost always correlated to higher prices. So even though the market is down, there are enough participants to retain liquidity. Without liquidity, prices collapse.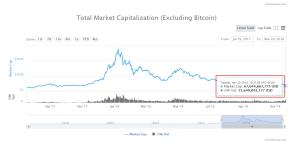
Current altcoin trading volume
That isn’t why we’re seeing this selloff, and it’s why we think this is a short-term bottoming-out. I’m not saying that we can expect a big jump tomorrow, but trading volume is a fundamental indicator of a healthy market.
Thought of the day...
This one is courtesy of David McClintock.
You can either buy Bitcoin now… or you can buy it later from the people who told you NOT to buy it now!
Something to consider.
MKR bounced up v.s. BTC, ETH
We talked about Maker (MKR) as a potential bargain during the market meltdown yesterday. The token made our day by erasing yesterday’s losses almost completely versus Bitcoin and Ethereum. Looking at MKR/BTC daily chart, the pair followed yesterday’s bearish engulfing with a massive bullish engulfing as the price dove inside the Ichimoku cloud.
Maker (MKR/BTC) - daily chart technical analysis
While historical data is still pretty limited on MKR, we can expect the price to be supported by the lower band of the daily Ichimoku cloud which coincides with the 23% Fibonacci retracement level at 0.072. With the future cloud flattening, we could expect the pair to consolidate between this support level and the resistance of 0.12.
Versus Ethereum, the chart shows almost similar patterns in a bit more aggressive way.
*This article was originally published here