
For all things Trump-affective going on out there, from Trump Tariffs, Trump Kim, Trump Putin, Trump Thumbs Up with the Wall, Trump Thumbs Down with Taxes, to all things otherwise-affective across the geopolitical and economic spectrum -- the list for which is both accelerative and inexhaustible -- 'tis remarkable that 'tis all quiet on the Golden front. And in a sense, with May having fully passed without price getting summarily sassed is a sigh of relief for Gold's investors and traders. To be sure, Gold's "expected daily trading range" has fallen to nearly half (11.9 points per day) from what it was (18.1 points per day) just back in late February. Obviously 'tis better to have range narrow and price consolidate than see the latter dissipate. Still, the ratio of "Gold's price movement to the world's goings-ons" seems quite small, the best bit being there is no real impetus to sell.
Neither -- at least not yet nor at large -- does there appear much motivation to buy. For with the turn of the calendar's month (plus one trading day) we find Gold's year-to-date net change again one big nothing burger. Rather as we go to our BEGOS Market Standings, the year net thus far is USA all the way with Oil, the Dollar and the S&P 500 leading the charge. And note therein that Sister Silver's net change is smack at the midpoint between Gold and Copper: one day she's adorned in her precious metal pinstripes, the next in her industrial metal jacket. Talk about goin' nowhere: Silver's "expected daily trading range" is now down to a mere 23.2¢, a tightness not recorded in better than a year. And for 2018-to-date, the white metal has settled 82 of her 105 trading days in the 16s. "Borrring!" Here's the whole lot from hot Oil to cold Copper:

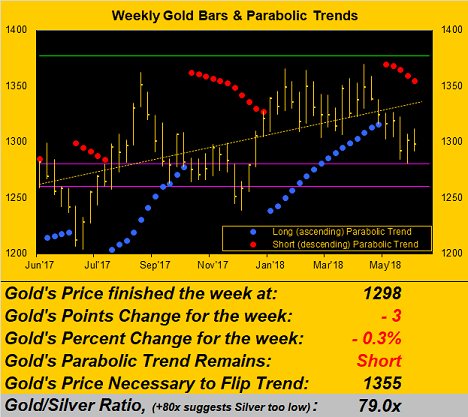
For the time being, we'll acquiesce to Gold's price consolidating vs. its plummeting: 'specially when by supply-adjusted debasement alone the yellow metal (which settled out this past week at 1298) "ought be" by our gold Scoreboard on the verge of surpassing the 2800 level for the first time. Still, in turning to Gold's weekly bars, we continue to see the "dual barrier" of The Whiny 1290s and The Box (1280-1260 as defined by the purple lines) acting in defense against the sellers, shorters, nay-sayers, crypto-creatures and other negative features:
As for the StateSide economy and stock market, it all seems to be stemming from the "Darting About Dept." One week the Economic Barometer's incoming metrics drive it down, the next week they drive it up. That doesn't do much for the S&P 500, which despite all the fawning over Q1 Earnings Season still finds its components profiting at but half the level they ought be to sustain current stock prices. That shan't in perpetuity last, as the S&P's stealth (for the time being) 25% correction down toward 2154 remains in play -- as does the intention of the Federal Open Market Committee to maintain its Bank's interest rate increases. Can stocks and the Econ Baro handle all that? Here's the picture:

Drilling down into Gold's near-term readings via the following two-panel graphic, we find on the left the "Baby Blues" of linear regression trend consistency having climbed out of their -80% basement, but only erratically at best, again with no real buying conviction beyond keeping price above 1280. In the 10-day Market Profile on the right, the swath spanning 1293-to-1310 underscores Gold's narrow, direction-less state of late:

'Course, seeing Silver also as "direction-less" is an understatement when viewing her dual-panel graphic. Extrapolate Silver's three-month trend and ten years hence she'll still be in the 16s. "Are we having fun yet?"

So as we've come through another month's end, here is Gold's broad-based structure by the monthly bars since price's All-Time High all too long ago across our defined strata. Per the price tracks in the Gold Scoreboard at the top of this missive, should the seasonality of the prior two years again kick into gear, June through August are Gold's chance to retake Base Camp 1377, which as we've suggested time-and-again ought swiftly open the door to our forecasted high price for this year of 1434. To quote Inspecteur Clouseau's directive to his devoted Cato: "Now is the time!"

We'll wrap this week's piece with this note:
By coincidence yesterday (Friday) morning, we found ourselves strolling past the floor-to-ceiling glass offices of the vaunted "Monoeci" project; (you regular readers know that of which we speak). Were it not for our then being en route to a pressing engagement further up the boulevard d'Italie, we impulsively considered going in ... 'cept that the place looked somewhat deserted. We'll see what unfolds in the new week. Just another hint to hang onto your Gold!