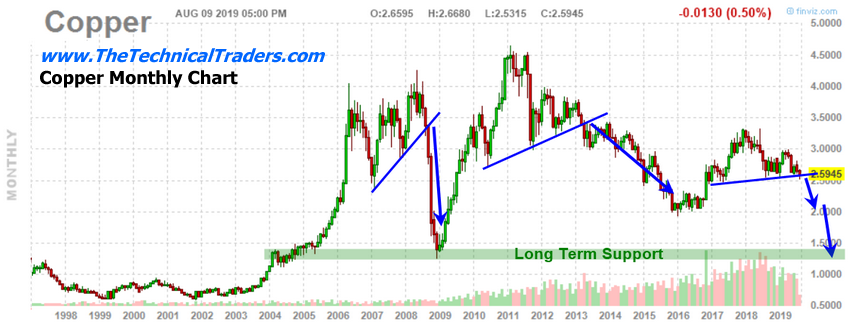
Copper is a fairly strong measure of the strength and capacity of the global economy and global manufacturing. Right now, Copper has been under quite a bit of pricing pressure and has fallen from levels above $4.50 (near 2011) to levels near $2.55. Most recently, Copper had rotated higher, to levels near $3.25, after President Trump was elected on November 2016, yet has recently fallen as trade and global economic concerns become more intense.
This should be viewed as a strong warning sign that institutional traders and investors are very concerned that the future economic and manufacturing activities throughout the world are continuing to contract. Copper is used in various forms throughout all types of manufacturing and consumer products, such as computers, building and infrastructure, electronics, chemical and medical use as well as automobile and aircraft manufacturing. It makes sense that copper prices would be a leading indicator for much of the global economy and relate to economic output and capacity.
Copper Monthly Long Term Chart
As the U.S./China trade war continues and we enter the final stretch of the U.S. Presidential election cycle, we believe that copper will break down below the $2.50 level and attempt to identify past support levels slightly below $1.50 over the next 6 to 12+ months. We believe the next big move in commodities will be a contraction move where certain commodities (mostly manufacturing and industrial related) will collapse as the world focuses on two of the most important events that are about to conclude in 16+ months: the U.S. Presidential elections and the Global Trade/Economic issues.

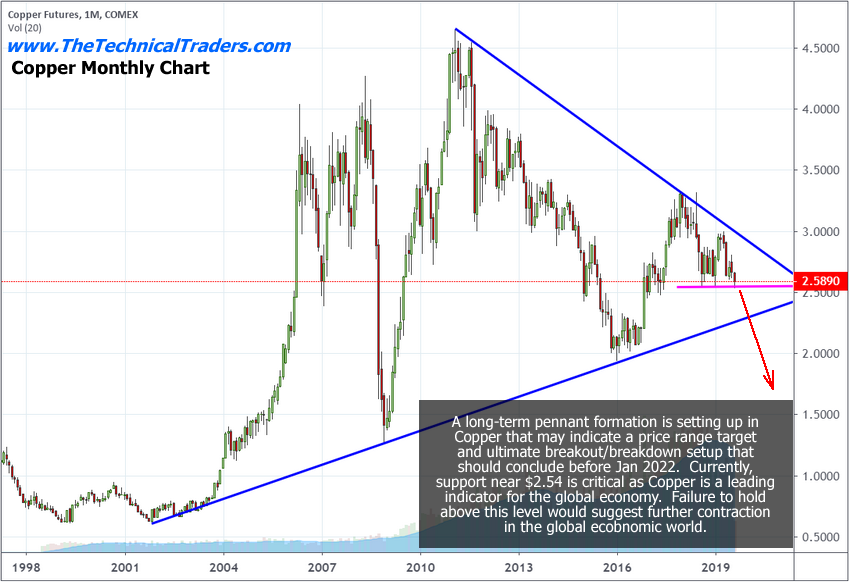
Copper Monthly Pennant Pattern
The breakdown in commodity prices as related to slower expectations and global economic demand may see a dramatic downside move or may see a more measured “slide” towards the $1.45 level (much like what we saw happen between 2013 and 2016). Overall, though, we believe the downside price move outweighs the upside at this time – unless some type of dramatic resolution to the U.S./China trade issues and global economic slowdown are ended.
We’ve also highlighted an extended long-term Pennant/Flag formation in Copper that should provide further insight as to the range of price rotation before the bigger breakdown in price occurs. This pennant formation will likely contain the immediate price range/rotation over the next few months to between $2.30 to $3.00. Should price break below the $2.25 level within the next 2~6+ months, then we would expect an immediate downside move towards the $1.50 level.

CONCLUDING THOUGHTS:
Following the core commodities as related to global economic and manufacturing demand and capacity are key elements to understanding how traders and investors are viewing the future expectations for the global markets. Commodities like Copper, Gold, Silver, Oil, Natural Gas and others can often be leading indicators related to global economic output and expectations. We urge all traders to prepare for a broader market contraction event over the next 6 to 12+ months based on our research that suggests Copper is setting up for a breakdown move.
