
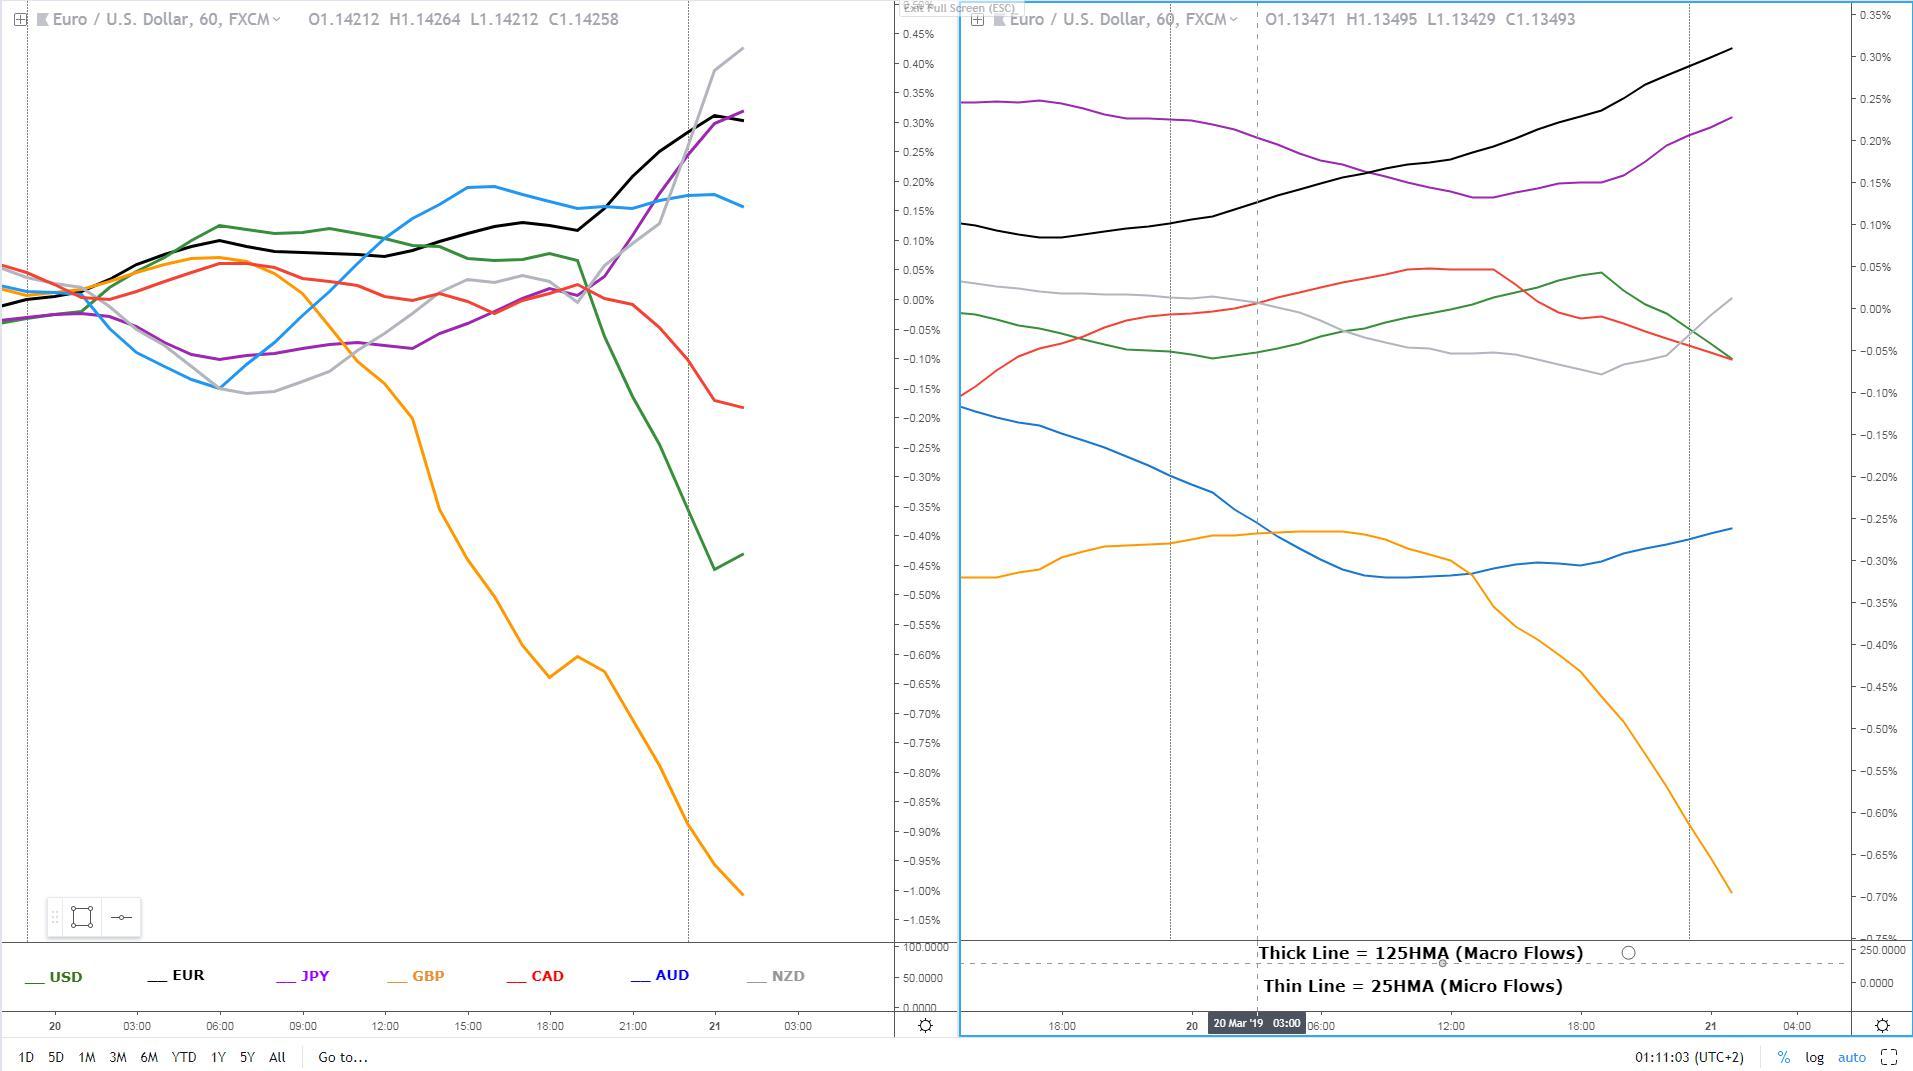
The JPY and the euro were the major beneficiaries from the crossfire of volume so badly needed in the Forex market. On the flip side, a battered USD, courtesy of a surprisingly dovish Fed, alongside a hammered GBP, were the two clear outperformers, especially the USD. Putting on a very solid performance we find the Oceanic currencies, the Australian dollar and the New Zealand dollar. They not only found an ample amount of demand but follow-up buying was noted after the release of the Australian jobs report and the New Zealand's GDP figures. Backpedaling its recent strength from earlier in the week is the CAD.
Key Narratives in Financial Markets
- The Fed was more dovish than the market had anticipated, and as a result, we’ve seen big moves down in the US dollar as well as in US yields. The Fed’s admission that the economic growth has slowed and that they will be patient to determine the future adjustments to the target range for interest rates was the first red flag of its overall dovish stance.
- What really sank the USD was the removal of the two-quarter points of rate rises from the ‘median’ dot plot rate outlook projection, which essentially means the Fed is not looking to raise rates anymore this year as opposed to 1 rate hike the market had expected. The 2020 median dot plot is for 1 rate hike, while 2021 was unchanged (implied of 2.5-2.75%). This has led to the market pricing a 45% chance of a rate cut by year-end now vs 30% prior.
- Making it worse for the US dollar, the Fed announced is set to taper its balance sheet shrinkage programme from $30bn to $15bn/month starting in May and end the process completely by September, which is earlier than what forecasters were calling for.
- The Fed’s core PCE inflation forecast was revised a tad lower to 1.9% from 2% this year, while a 0.1bp reduction to 2% from 2.1% was also observed for 2021. Meanwhile, reinforcing the dovish outcome, the Fed revised up its unemployment estimates to 3.7% from 3.5% this year, which implies that they see a labor market no longer at full capacity.
- The sterling was also pressured across the board after UK PM May says she is only looking to request a short-term Article 50 extension to June 30th as previously rumored. ECB President Tusk said an extension will be under consideration and most likely possible but conditioned to the House of Commons in the UK passing May’s Brexit bill, set to take place (again) next week.
- According to US President Trump, the intention is for the US to leave the existing tariffs on China for a long period of time until they comply and there is sufficient evidence that whatever deal is agreed will be in full compliance and respected in detail. US trade negotiators are set to travel to China next week to resume talks in order to make further progress but as it stands, with considerable sticking points still in place, the market is starting to suspect a deal may be taking longer than previously expected, with reports that a potential signing ceremony between Trump and Xi not to happen until at least May or June, assuming they do hash out a deal.
- The Australian jobs data came with an upbeat jobless rate at 4.9% vs 5% expected, and despite the headline number failed to miss the estimates, the Australian dollar was re-ignited to hit a fresh 7-week high. The participation rate and the full-time employment changes were a miss.
- The NZ GDP for Q4 came in line with market calls at 0.6%, which makes the reading a little more pessimistic compared to the estimates of the RBNZ. The conclusion after analyzing the data is that a rate cut by the RBNZ should not be ruled out should the trend of growth deceleration continue.
Recent Economic Indicators & Events Ahead
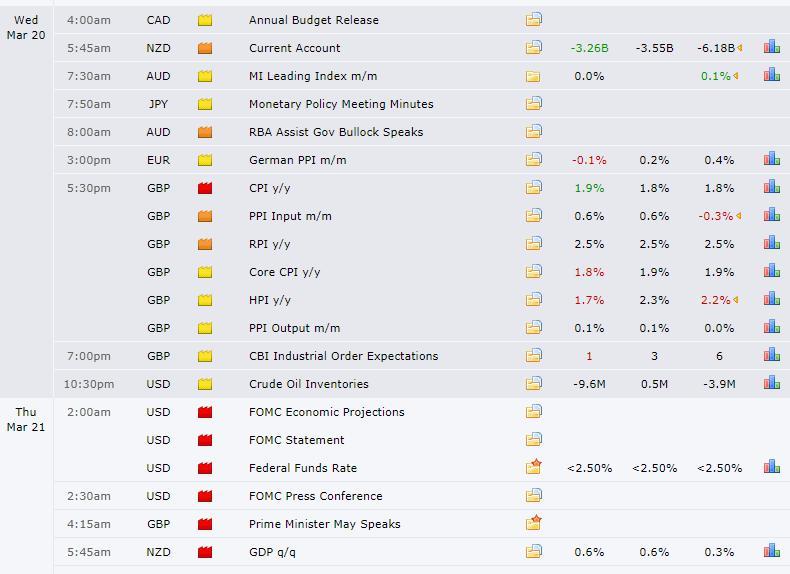
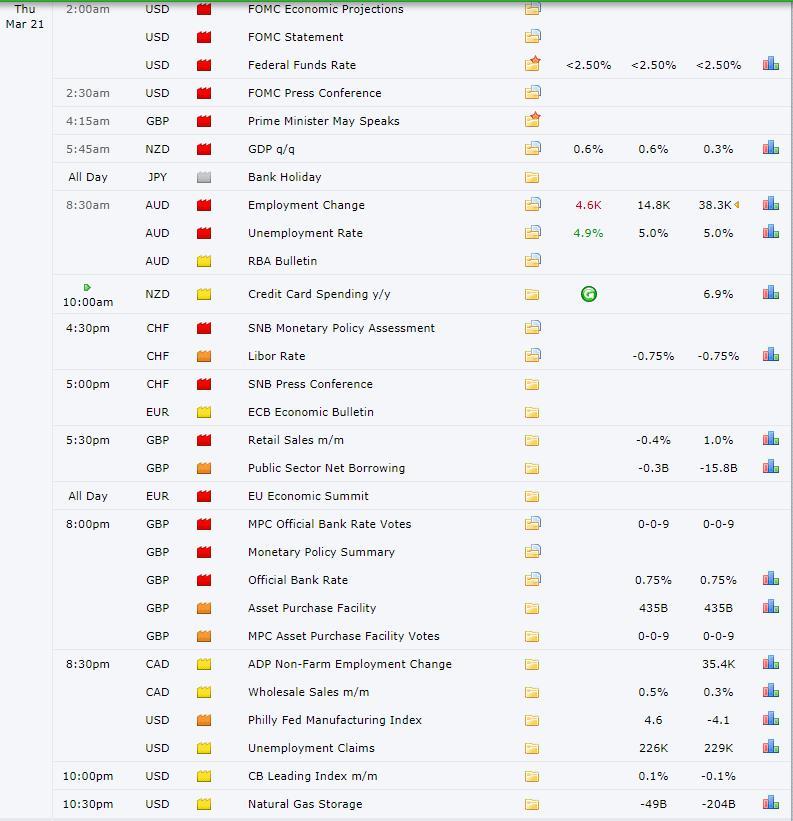
Source: Forexfactory
RORO - Risk On Risk Off Conditions
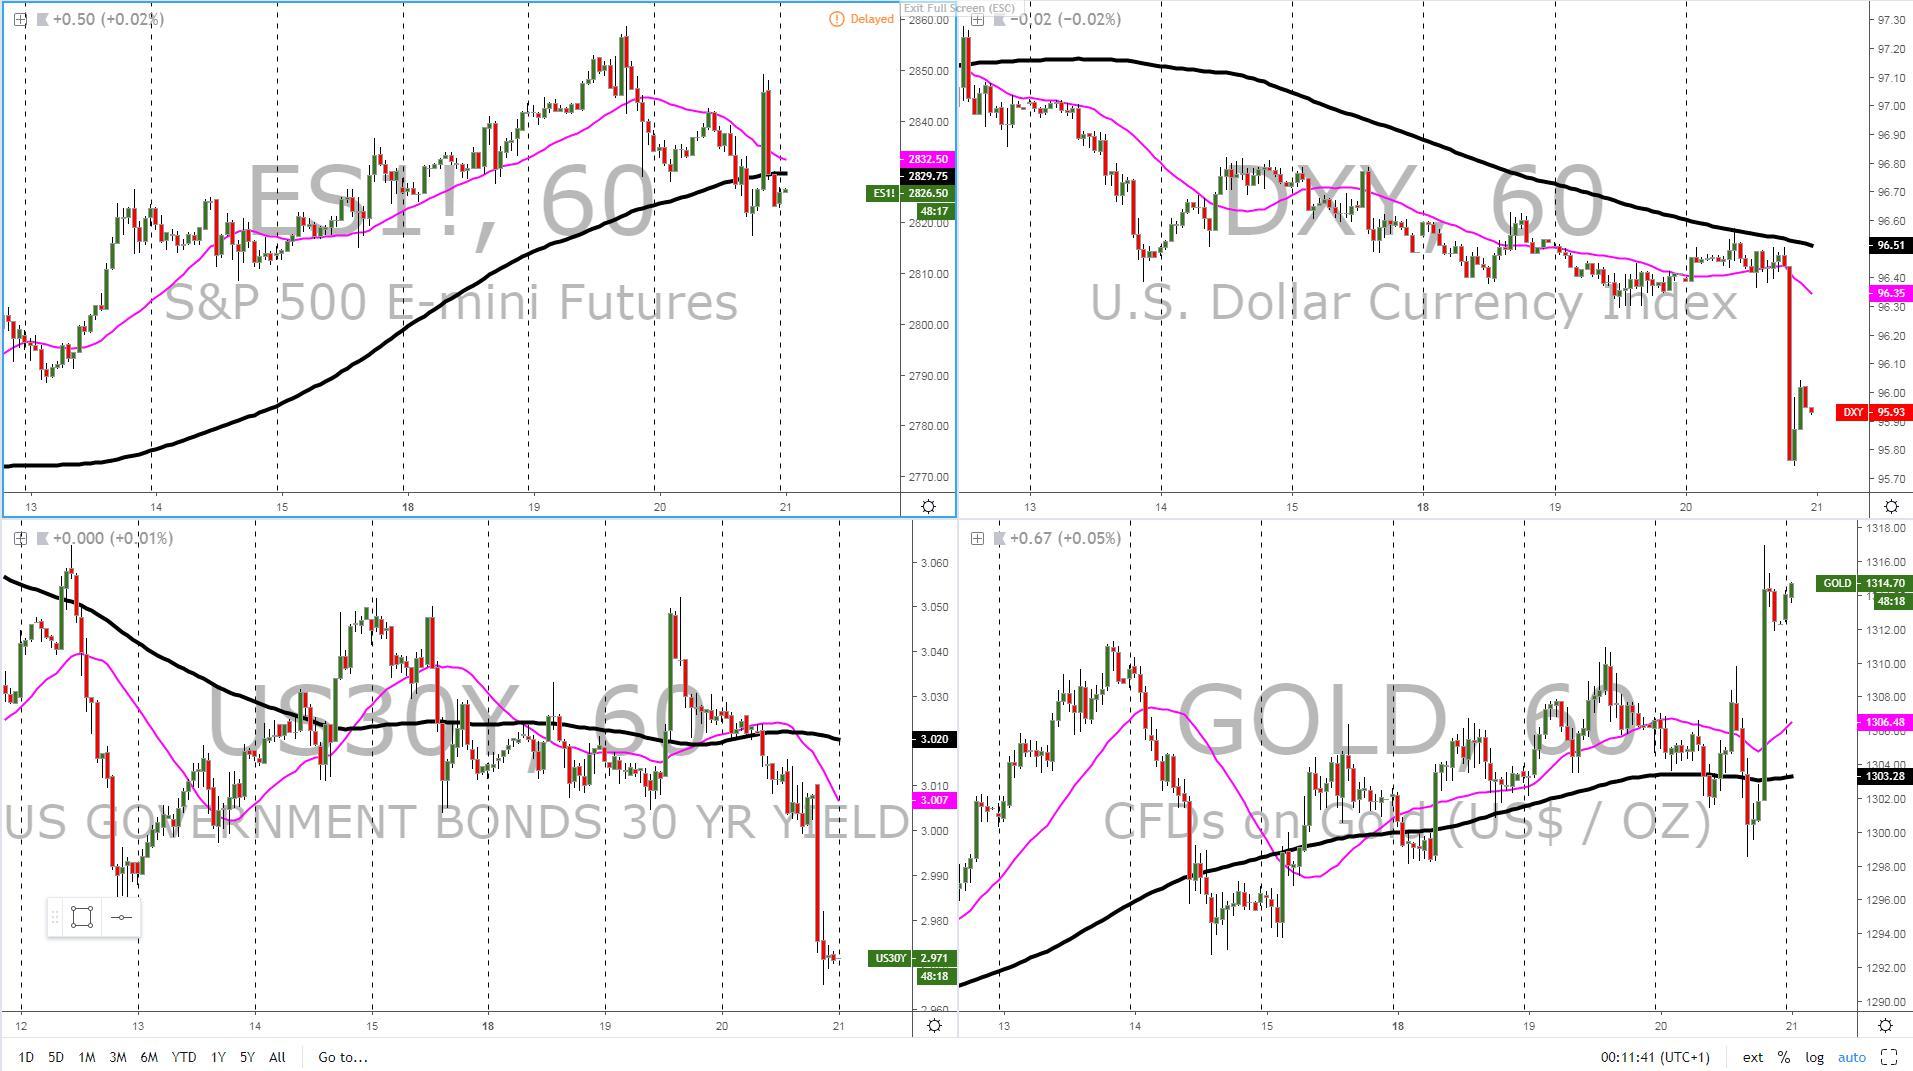
Short-term, the environment has turned strongly USD negative, but this time with the added caveat of lower equities for the second day in a row, as the micro bearish slope in the S&P 500 indicates. Under these dynamics, the Japanese yen will always be the shelter that the market flocks off to for protection, and that’s precisely what transpired during Wednesday, with the Euro, in line with its low yielding status, which makes it a funding currency, also ripping the benefits of the deleveraging away for the US dollar.
Either it is from a daily or from a weekly analysis, one trend is clear, and that’s the selling of the USD, what remains more uncertain is to convey the outlook for the overall risk, which has been left to equities as the ultimate arbitrare, as has been the case for most of 2019.
This matters, because if the sell-off sell off continues to gather steam on lower equities, the degree of strength to be expected in currencies such as the JPY can be largely magnified. If equities do recover their mojo in line with the macro bullish trend as per the slope of the 5-DMA, then expect currencies such as the AUD, NZD, CAD to perform better. Remember, you must always account for fundamentally-driven events that can also alter these scenarios.
Intermarket Flows and Technical Analysis
EUR/USD: Strong Buy-Side Momentum, Resort To Intraday Levels
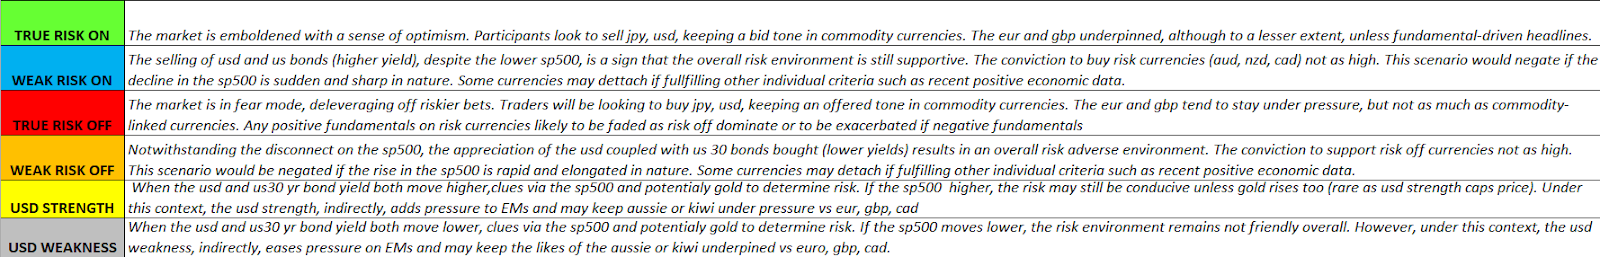
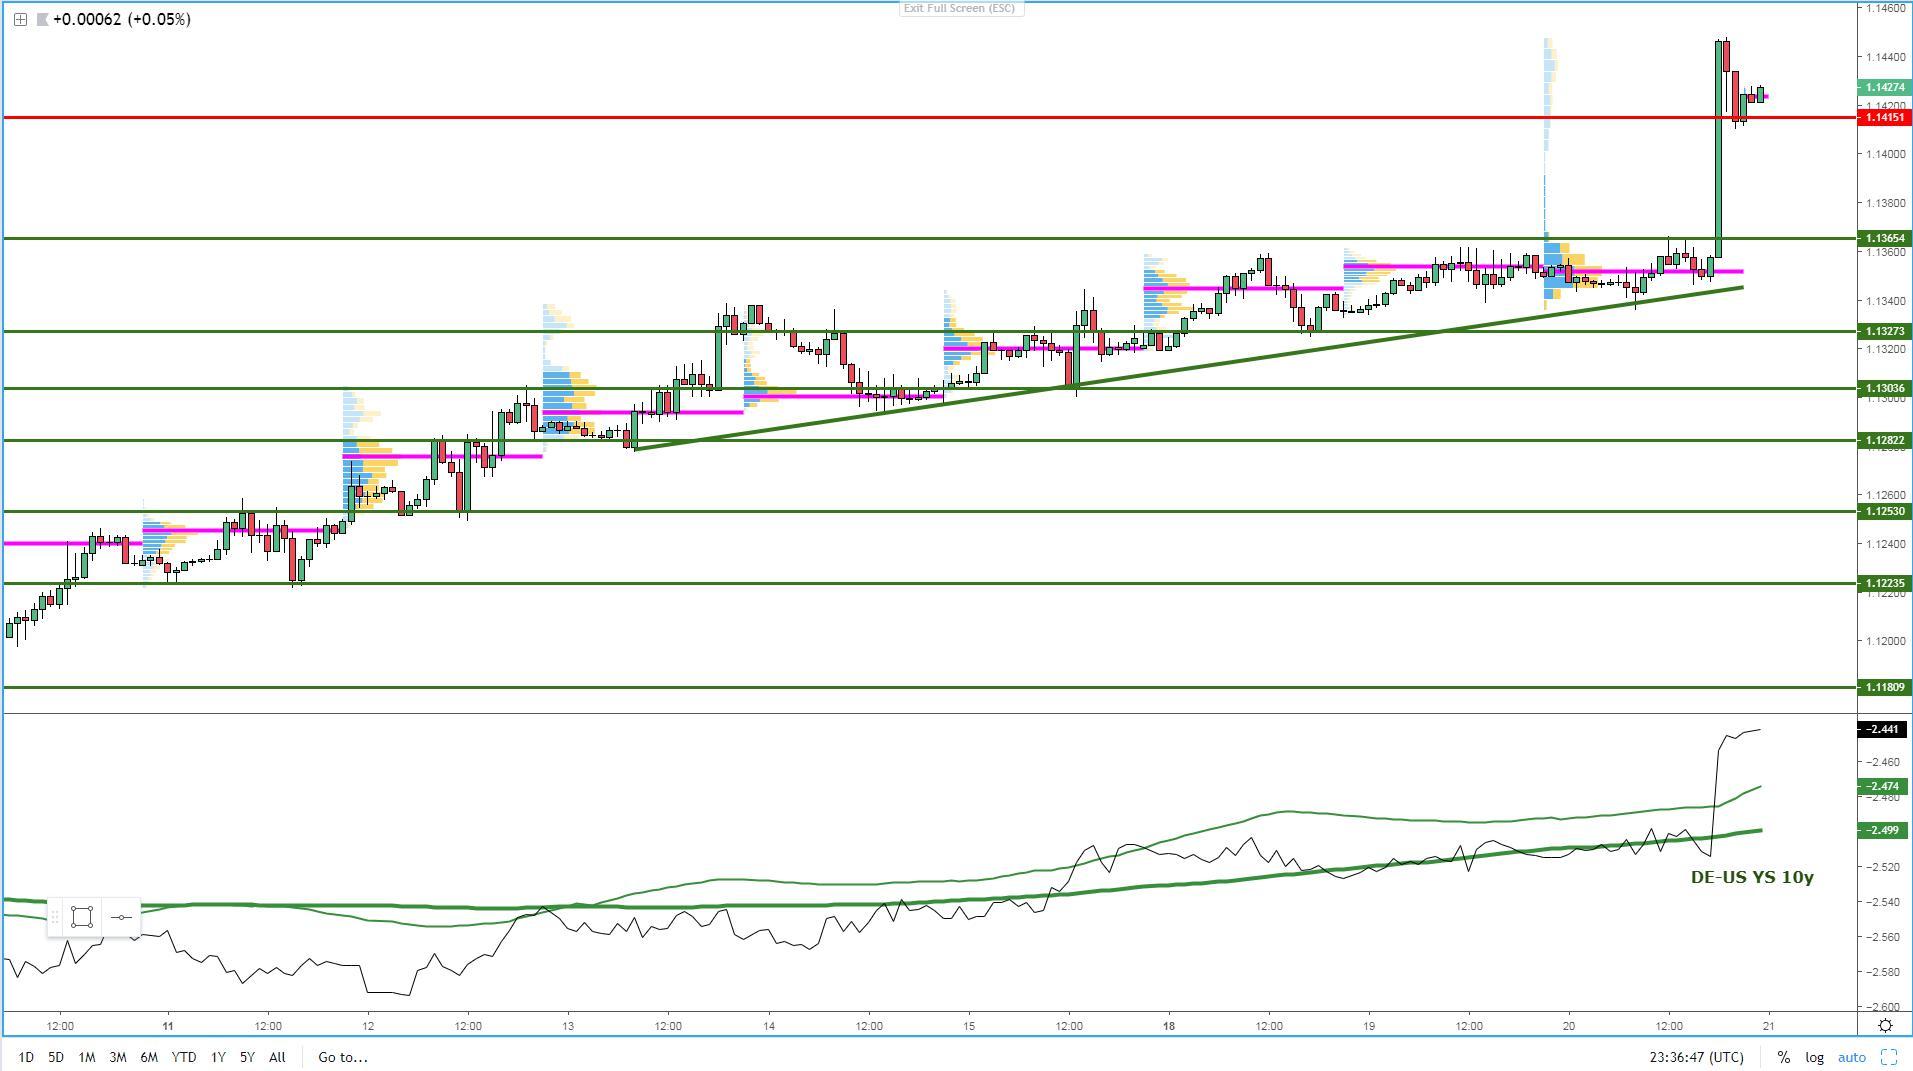
The surprisingly dovish FOMC has sent shockwaves which makes the market go through a period of macro re-evaluation towards the US dollar. Real and fast money are likely to keep jumping onto the USD bear bandwagon, which means potential shallow pullbacks at intraday decision points for a further extension of the strong bullish momentum. The close at the highs of the day, with the volume profile forming a double distribution up strengthens the chances of a continuation higher. Besides, the fair valuation in the exchange rate based on the major narrowing of the German vs US bond yield spread (10y) is congruent with the spike in prices, further supporting the notion of buy on dips. In terms of market structure, the upthrust bar post FOMC has set into motion what looks to be the potential beginnings of a fresh bullish cycle judging by the magnitude and speed of the move. It’s worth noting, even if the majority of the vol may be concentrated in the GBP, that the EU-Brexit Summit get underway today, which becomes a sources of spontaneous vol events intraday on a headline by headline basis. The fact that the Euro was bought up to the boots even as the GBP fell sharply on Wed, is a positive sign, as it reflects less dependency on Brexit headlines.
GBP/USD: Choppy Moves As Both Currencies Unloved
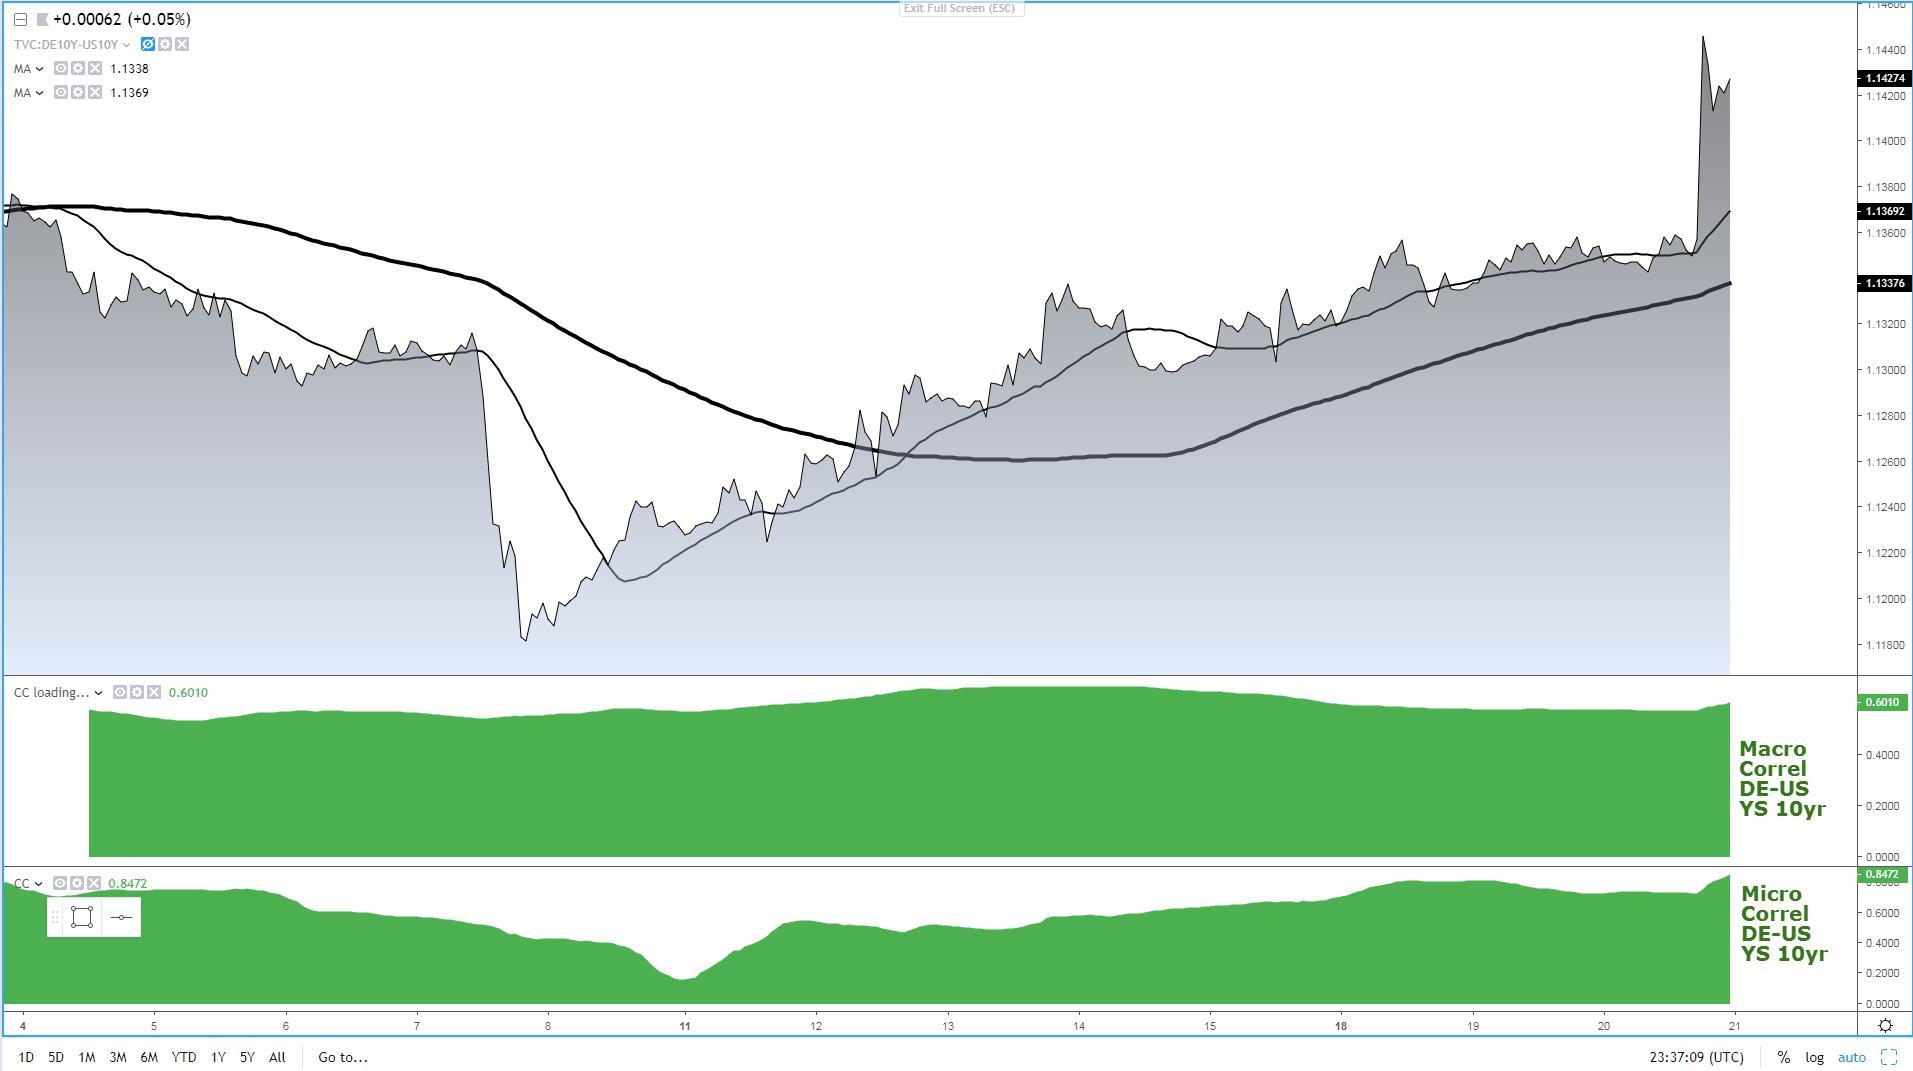
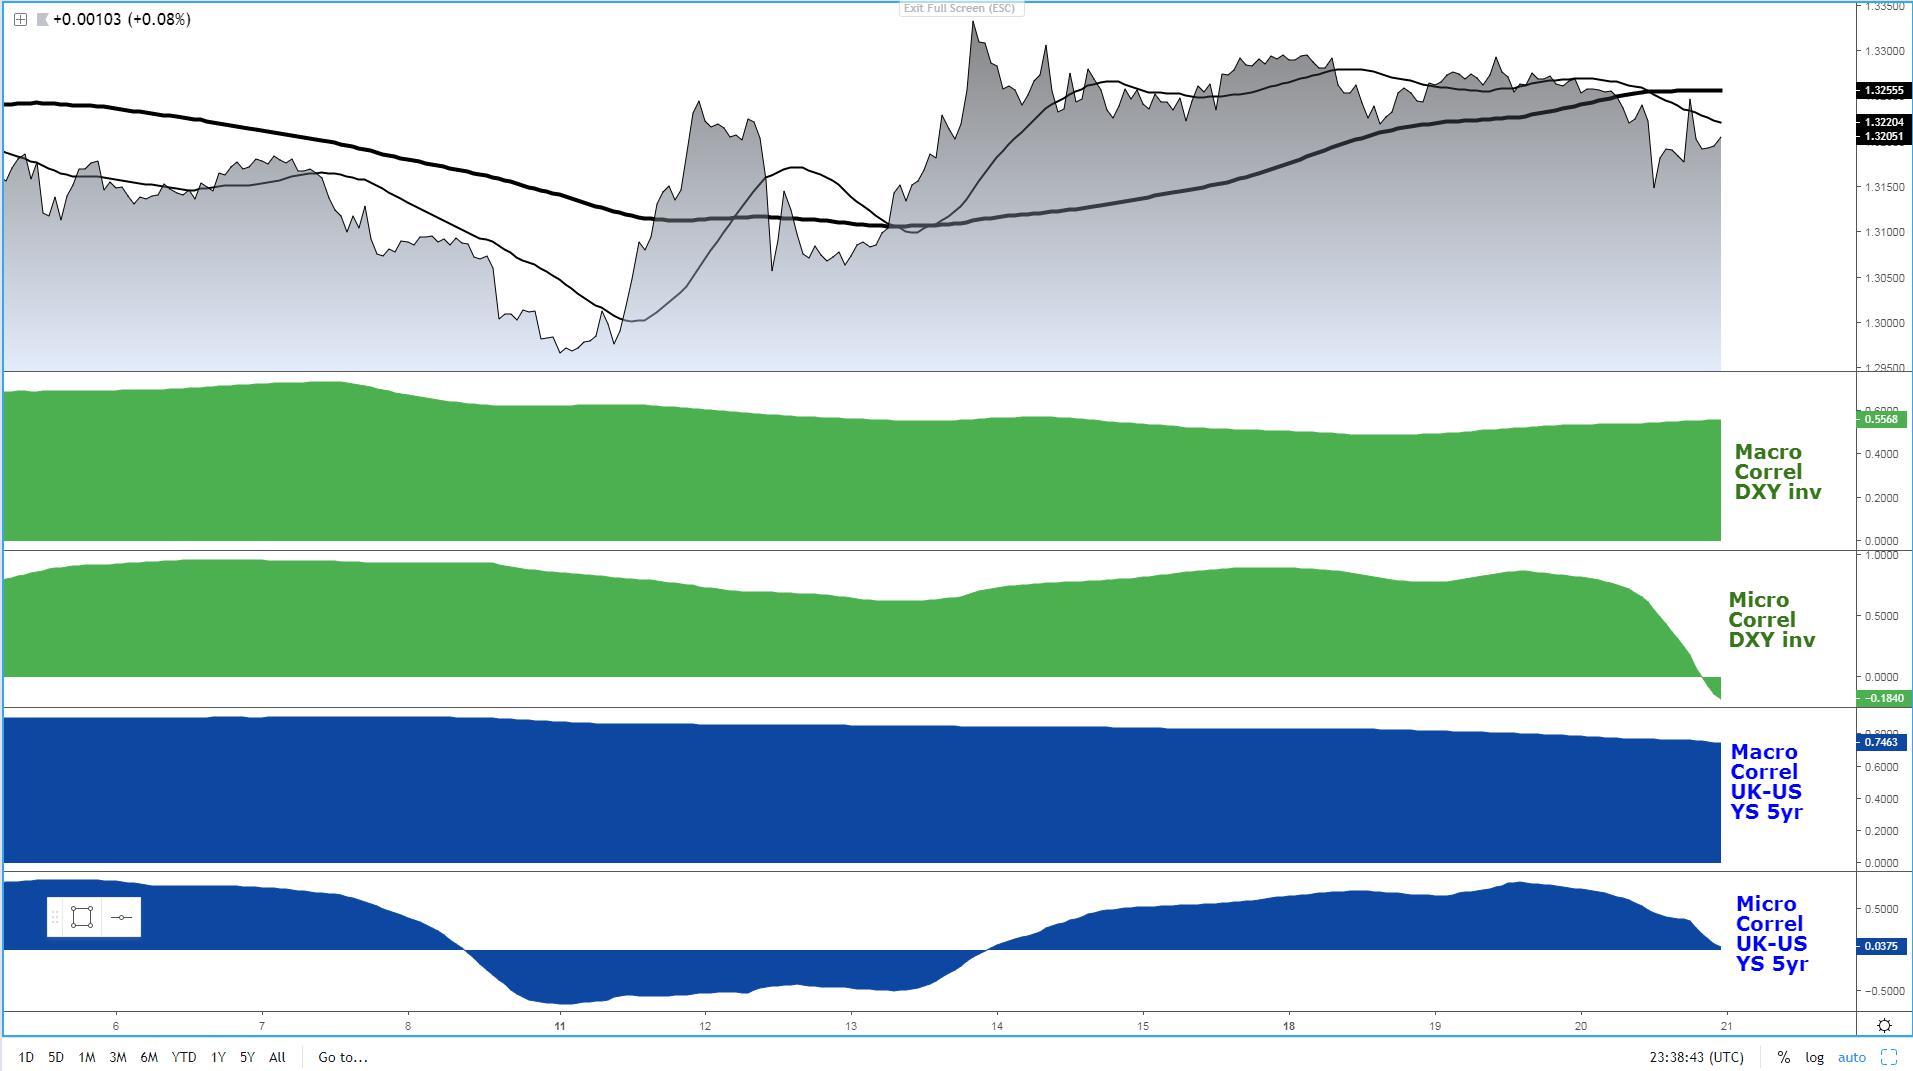
An extension of the price action wrangling with clear characterizations of a directionless market, as the yo-yo type swings from Wednesday reflect. Both currencies were badly punished by the two hottest narratives market were fixated with (FOMC and ongoing Brexit developments). By the end of business in NY, the sterling managed to recover most of its losses on the back of the dovish FOMC, and judging by the intermarket flows, we’ve now entered a period of buy-side bias based on the synchronicity of micro/macro slopes in the DXY (inverted) and the UK-US bond yield spread. However, be warned that we are at the peak of the Brexit pandemonium-led vol, which means that trading around potential times when headlines may arise (Brexit summit underway from today) makes any short-term trading engagement inherently riskier given the erratic headline-by--headline vol, which is going to make the GBP behave not necessarily in line with the cues obtained by the DXY, more so by the fluctuations in the bond yield spread as a barometer of optimism in the Brexit process. If you look to exploit movements in the currency market, there are way better currency alternatives to exploit the USD weakness than dipping one’s toes in the wildly unstable GBP and its price action.
USD/JPY: Ferociously Sold, Perfect Bearish Storm
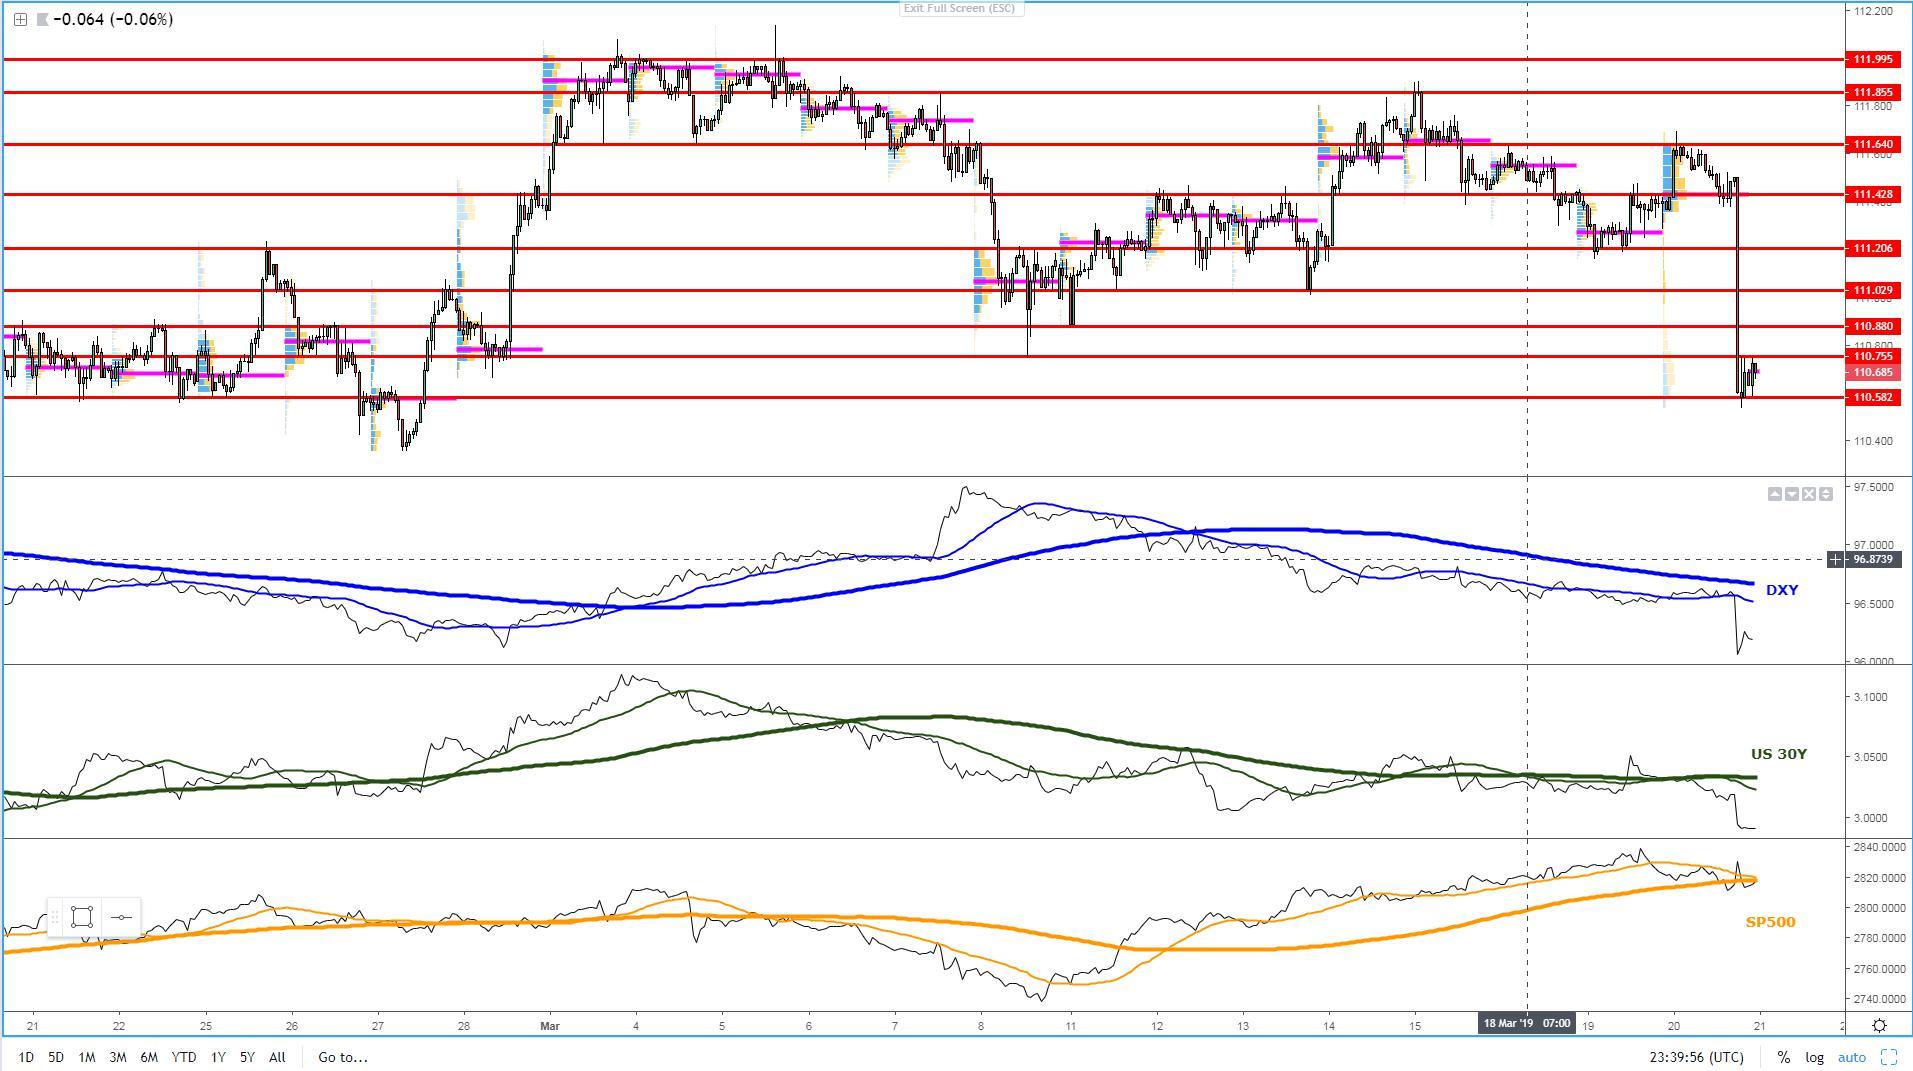
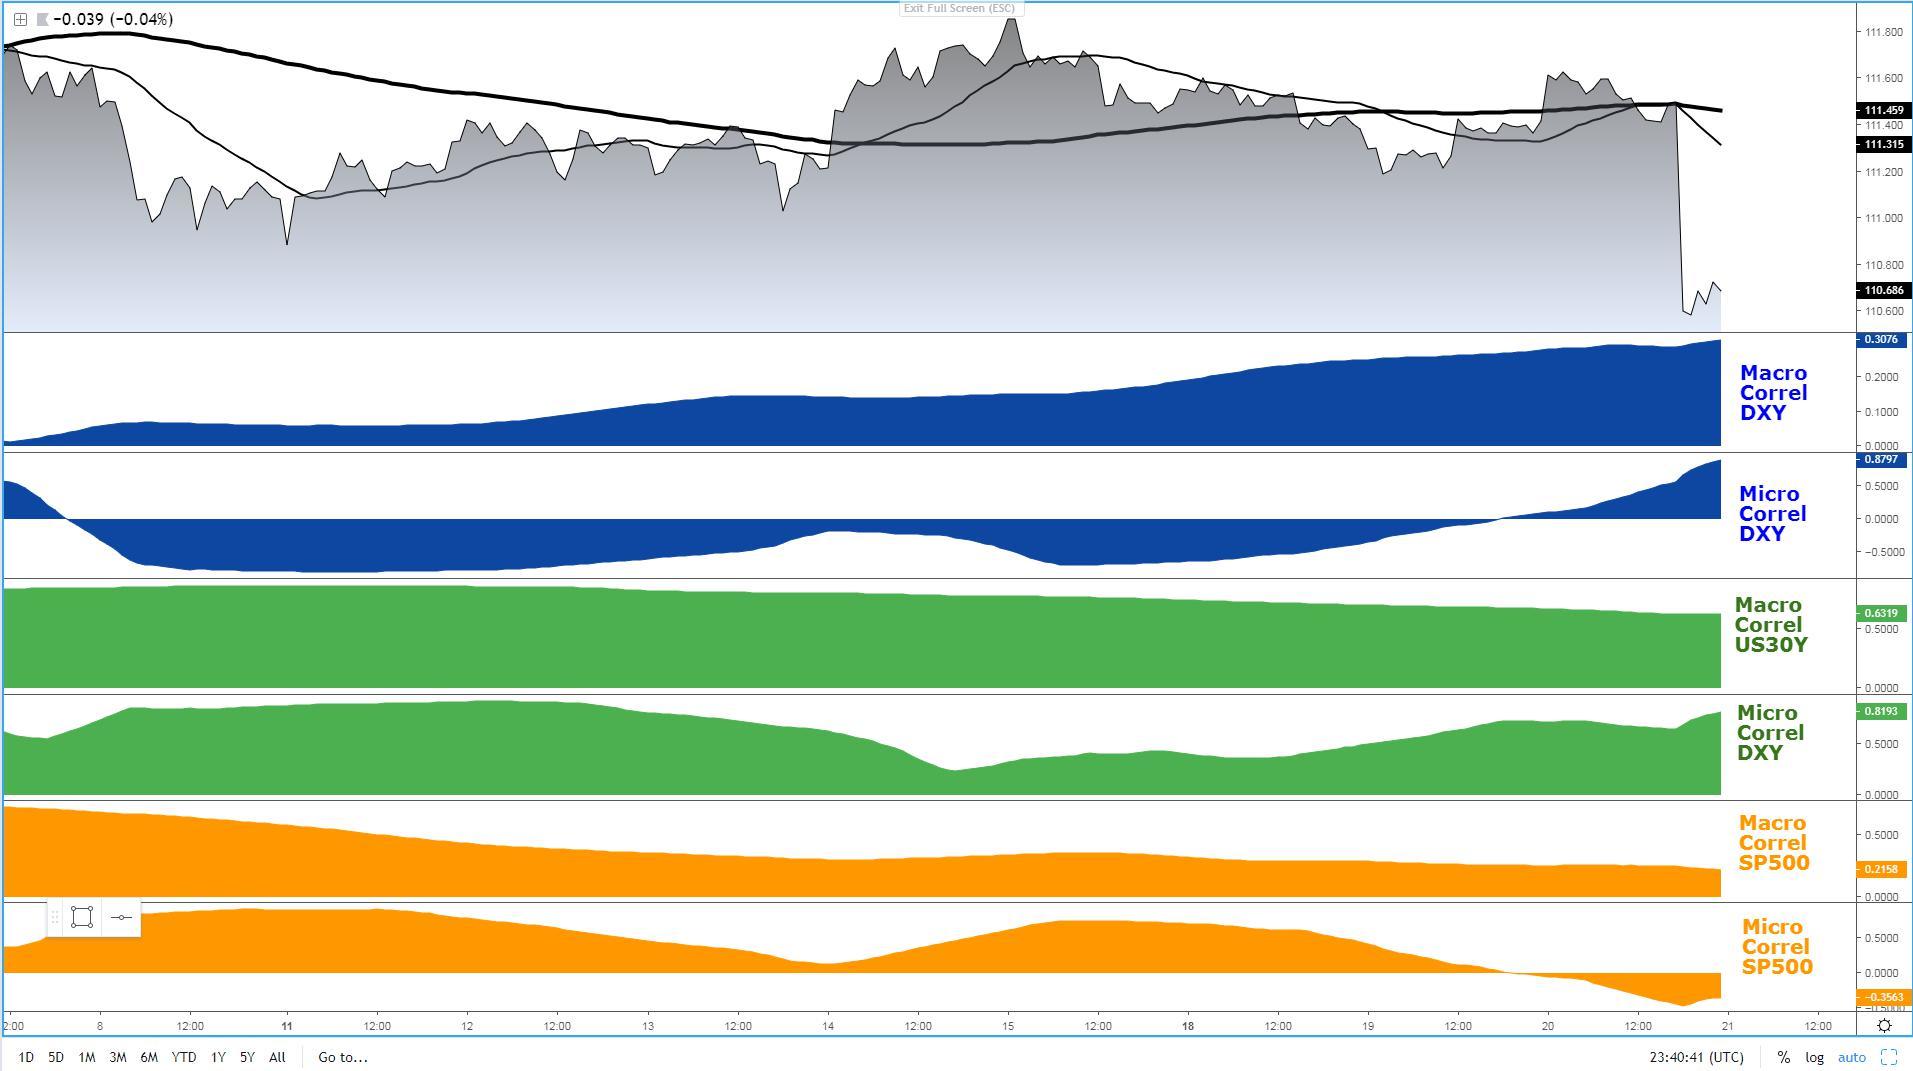
Mark my words here. Whenever you see the DXY and US 30y bond yields move in the same direction, as shown in yesterday's YT video, the exchange rate in the USD/JPY is going to pay the consequences by adjusting lower in the vast majority of cases. Throw into the mix a predominantly bearish mood in equities for the last 2 days, and the downside risk is only going to be magnified, as it has eventuated. In the accompanying chart, I’ve drawn a series of horizontal levels of resistance, with each and every one of them potentially acting as an area to re-engage in sell-side action. The fact that as I am writing these lines the price has been struggling to recover even the very first level of the mentioned resistances around 110.75 is a clear testament of the depressed flows towards the US dollar. As in the case of the EUR/USD, where shallow pullbacks before a resumption of the trend is a real possibility, the same can be said when it comes to the USD/JPY. However, be aware that if you are not trading to catch intraday movements but instead you are inclined to swing or day trading, the current levels are largely unattractive, with a retest towards 111.00 up to 111.20, at the bare minimum, a more sensible strategy to improve the prospects of a better risk-reward (major assumption about your style!).
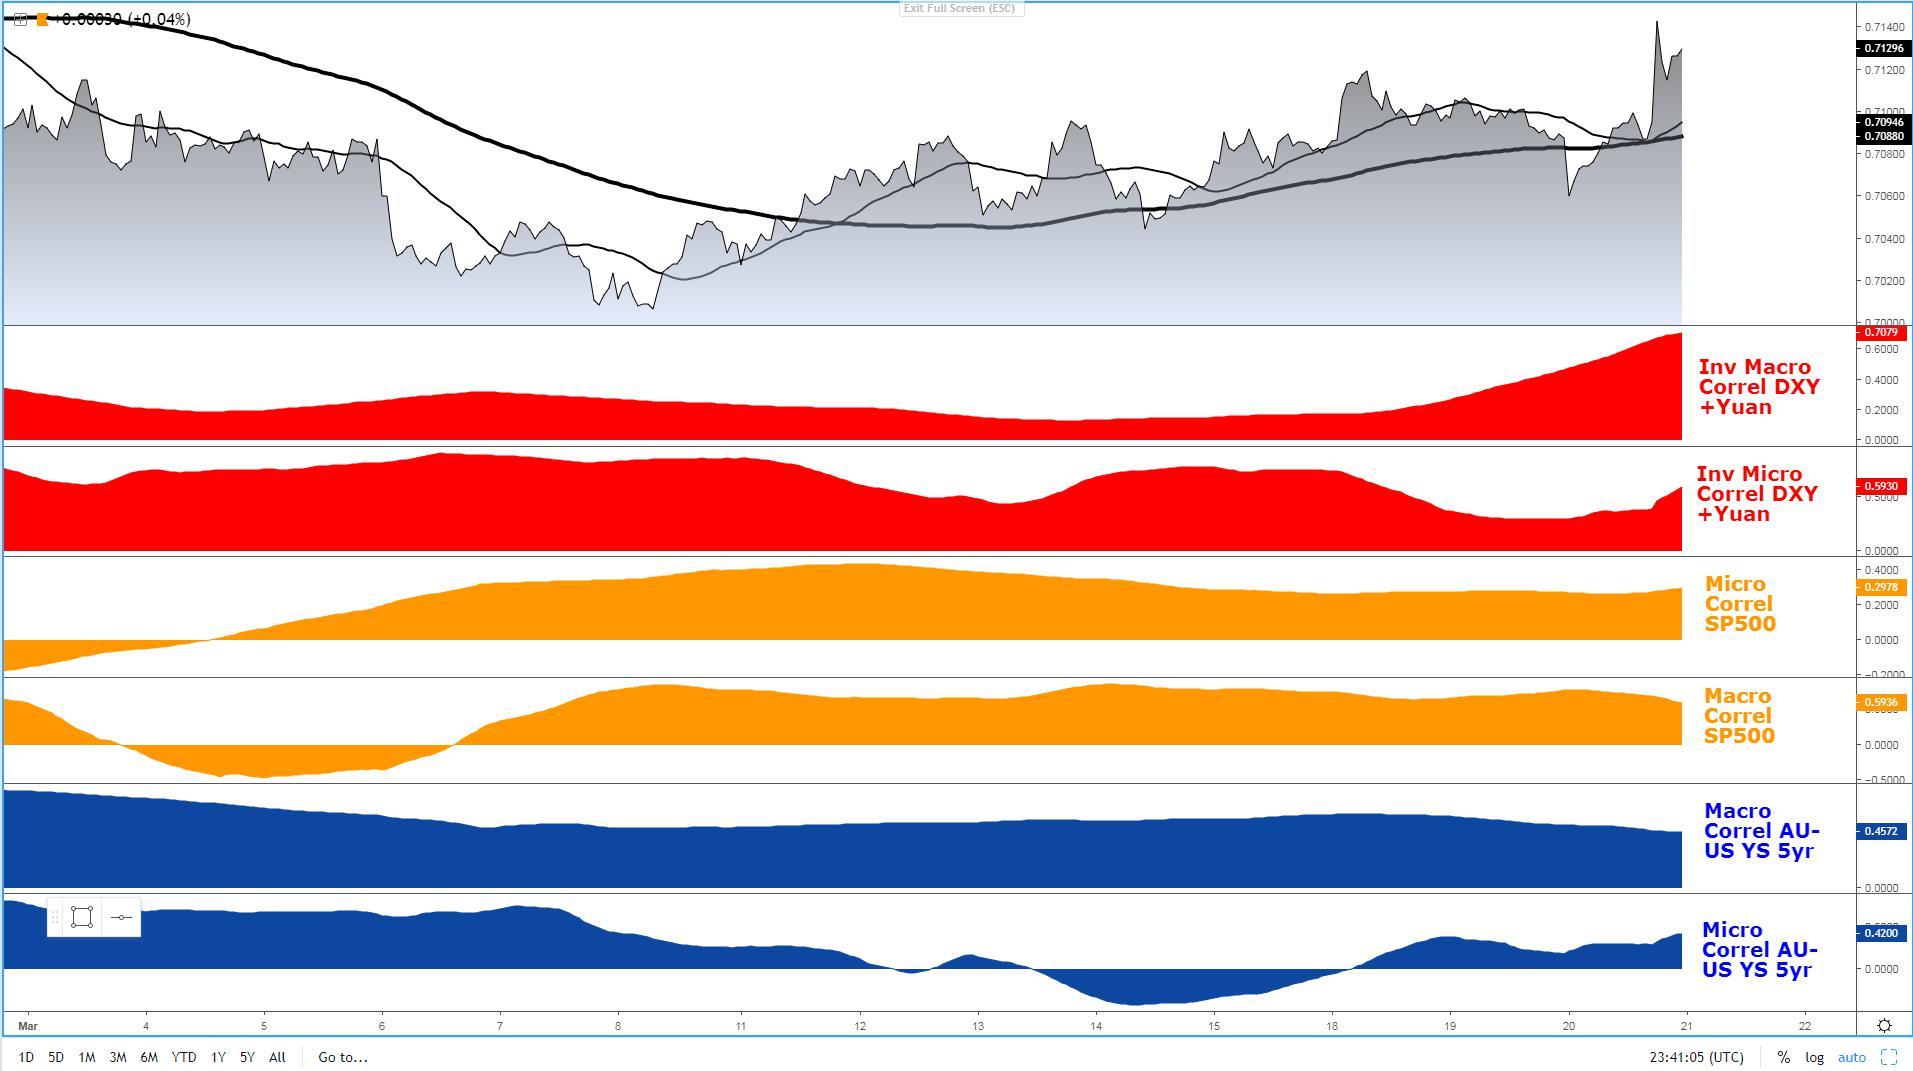
AUD/USD: Aus jobs, FOMC Send Rate To Highest in 7 Weeks
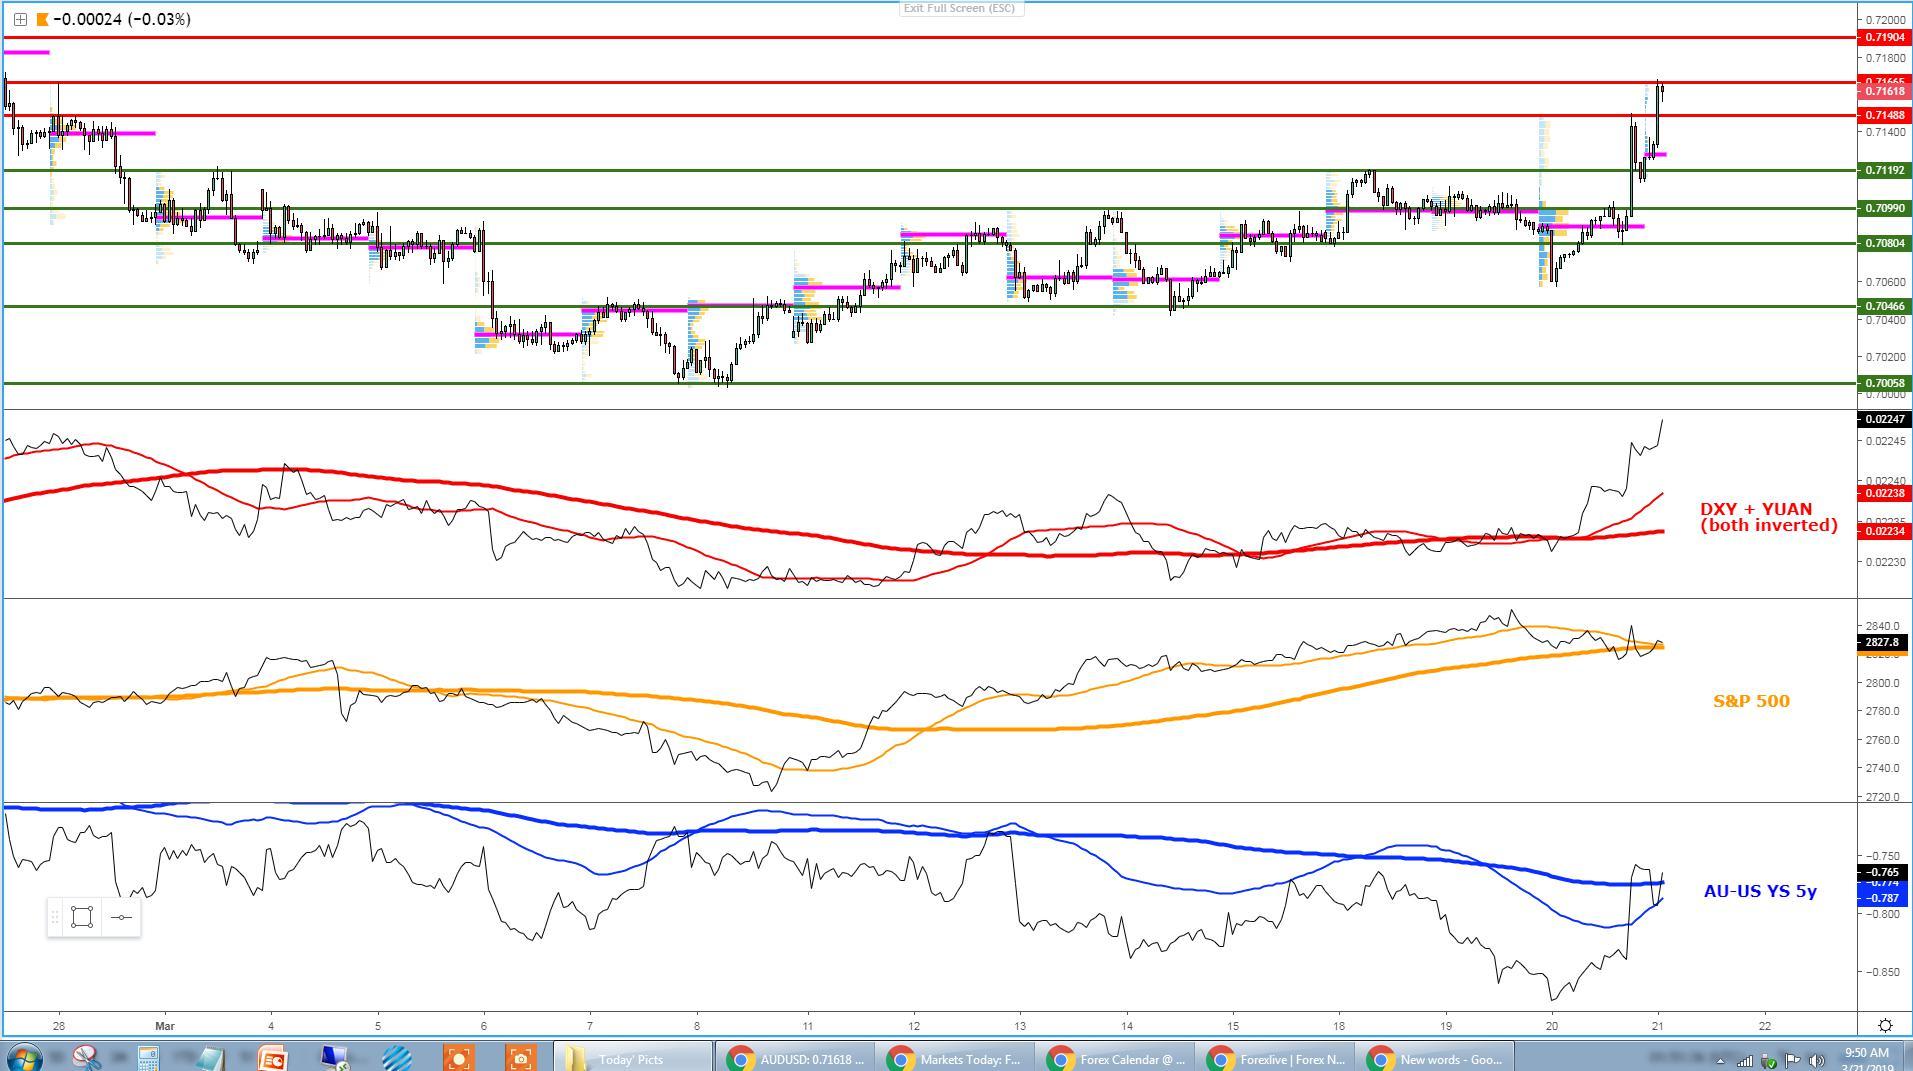
Not only does the FOMC outcome vindicate the bullish movement in the Aussie, but the reduction in the unemployment rate in Australia from 5% to 4.9%, despite not accompanied by a beat in the jobs headline number, has sufficed to send the exchange rate above 0.7150. Note, the Aussie has not been able to gather as decisive buying flows as the euro or the yen, given that the US-Sino trade talks appear to have hit a wall that may see further delays to ink a deal, and as we all know, there is no better and more efficient way to trade China than through the Australian dollar as a proxy. For now, judging by the intermarket flows in the hourly, I consider the market to be predominantly in buying mode only as well, with the flows in the DXY, yuan (both inverted) as well as in the AU-US bond yield spread backing up the trend. The only downside that may act as a counterbalance effect is the short-term gloomy mood in stocks as the bearish micro slope in the S&P 500 reflects. The best course of action, until micro intermarket flows shift, is to support the buy-side bias.
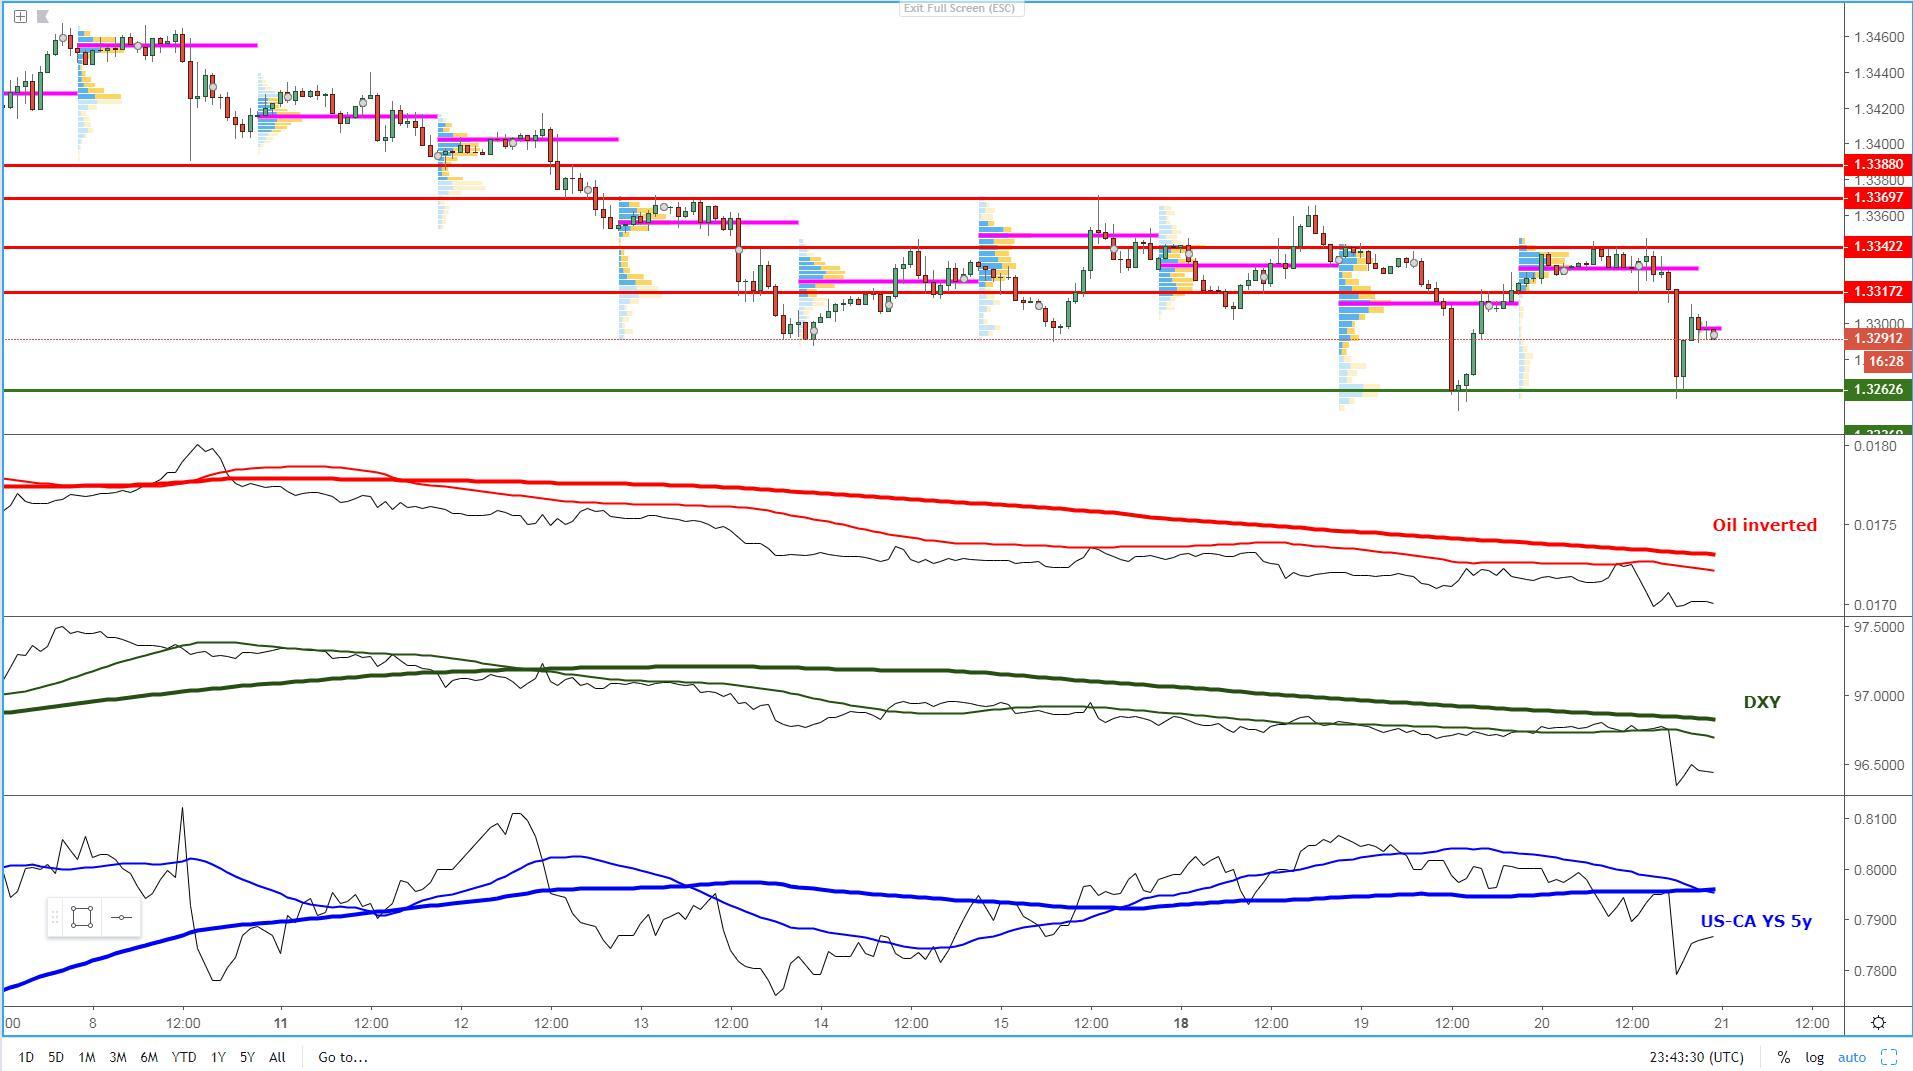
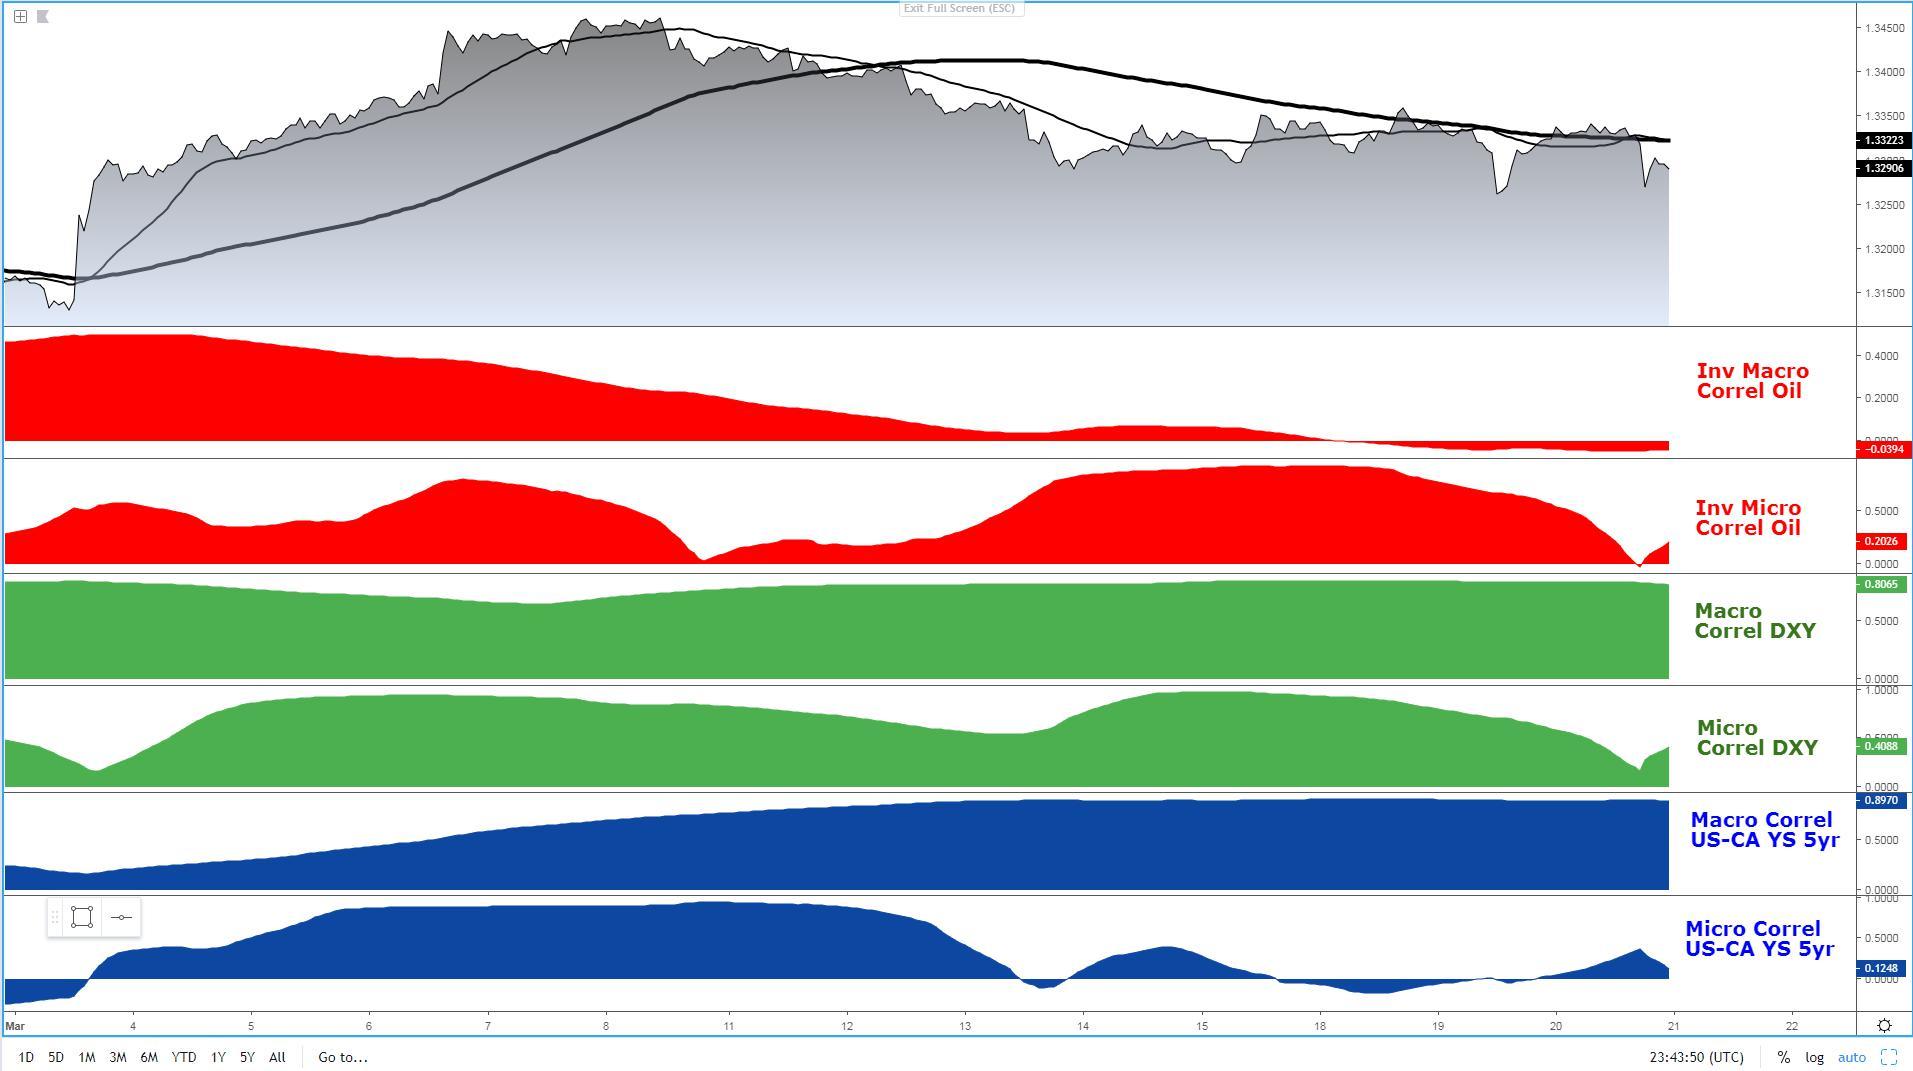
USD/CAD: Prospects Of Further Selling Justified
As I ask myself, is the pair’s backdrop conducive for an extension of the losses seen on the back of the dovish FOMC? The unambiguous answer would be ‘Yes, it is’. The congruence is clear, with Oil on the rise, the DXY falling off a cliff and the US-CA bond yield spread revisiting its Feb lows. However, it’s not only a matter of deciphering intermarket flows, but also marrying that up with technicals, which as a caveat, are not yet as clear cut as intermarket is. The reason being is because the pair has failed to break into lower lows to instead find a cluster of bids circa 1.3260, as was the case on March 19th. What this means is that the market should still be potentially treated as being in the process of a potential range until we do see a breakout lower before. That said, there is no reason to think that buy-side attempts off 1.3260 or thereabouts will gather much momentum as things stand.
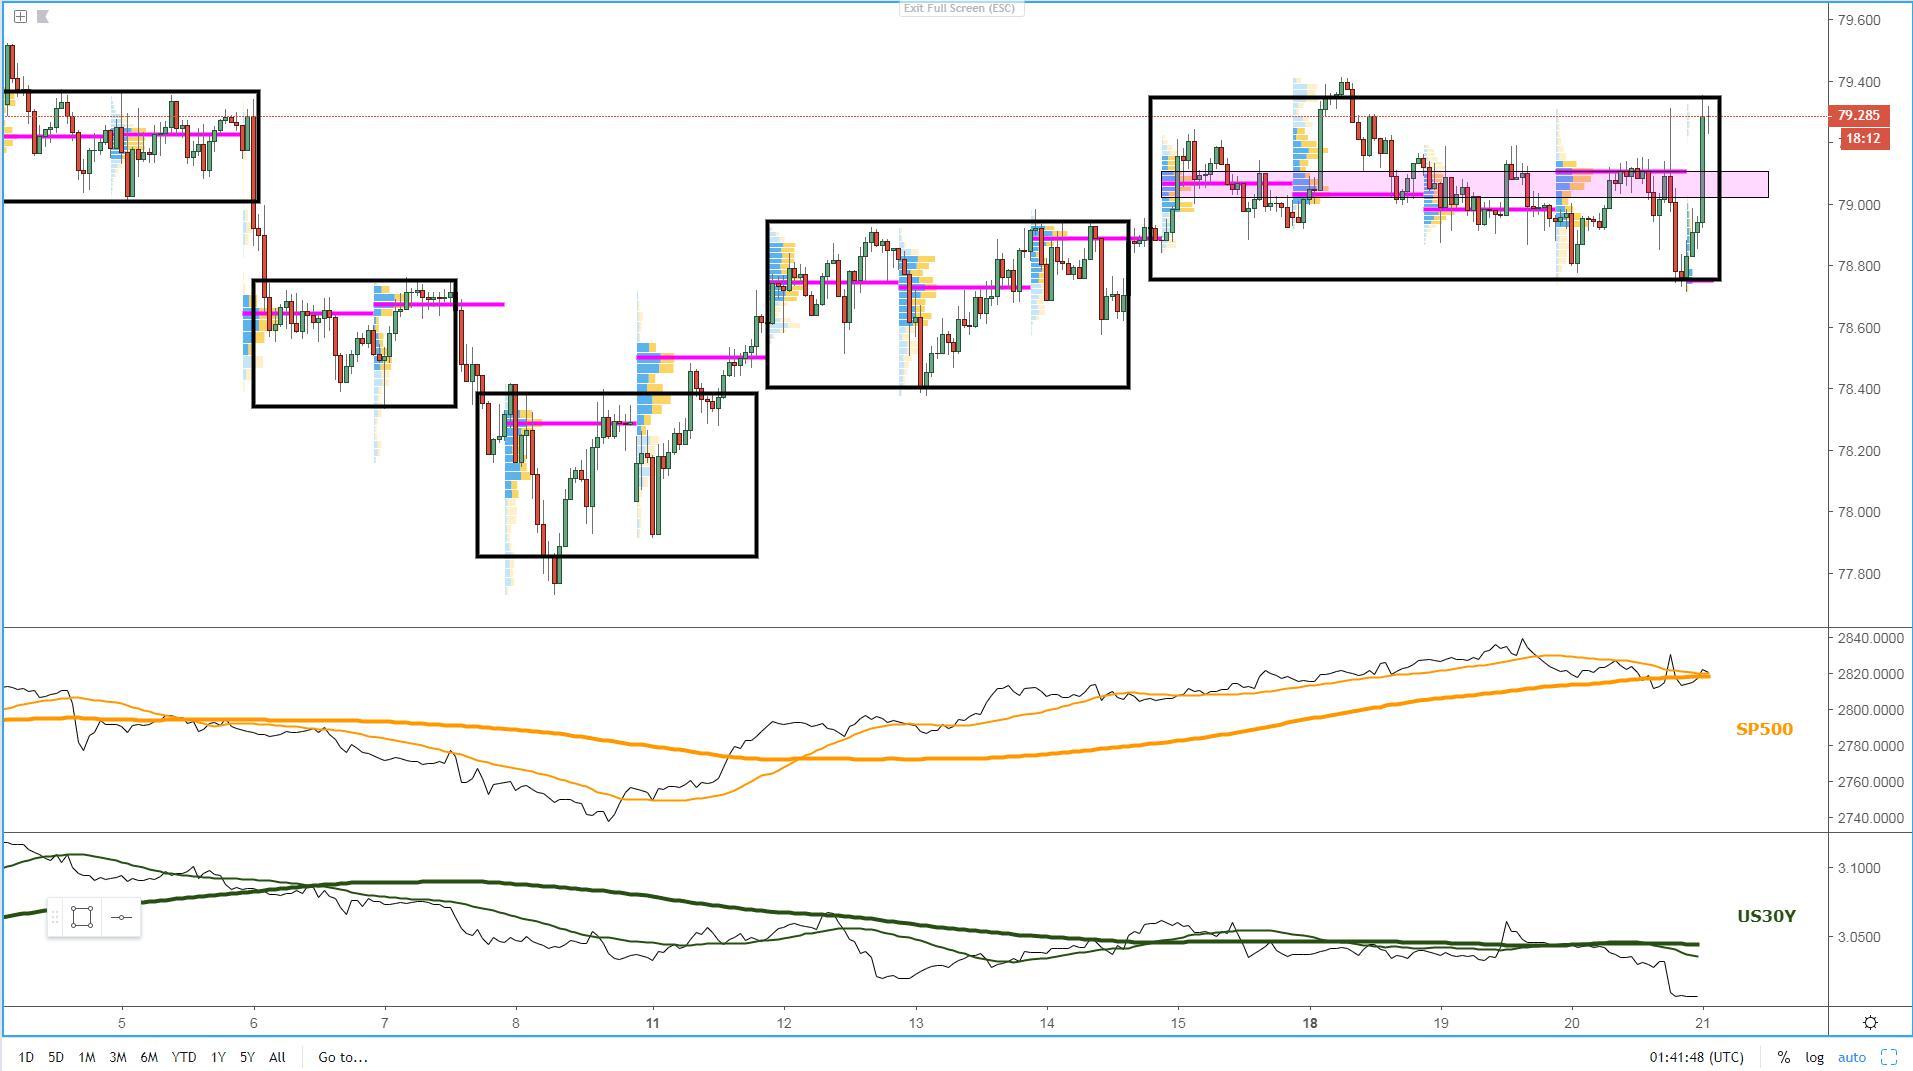
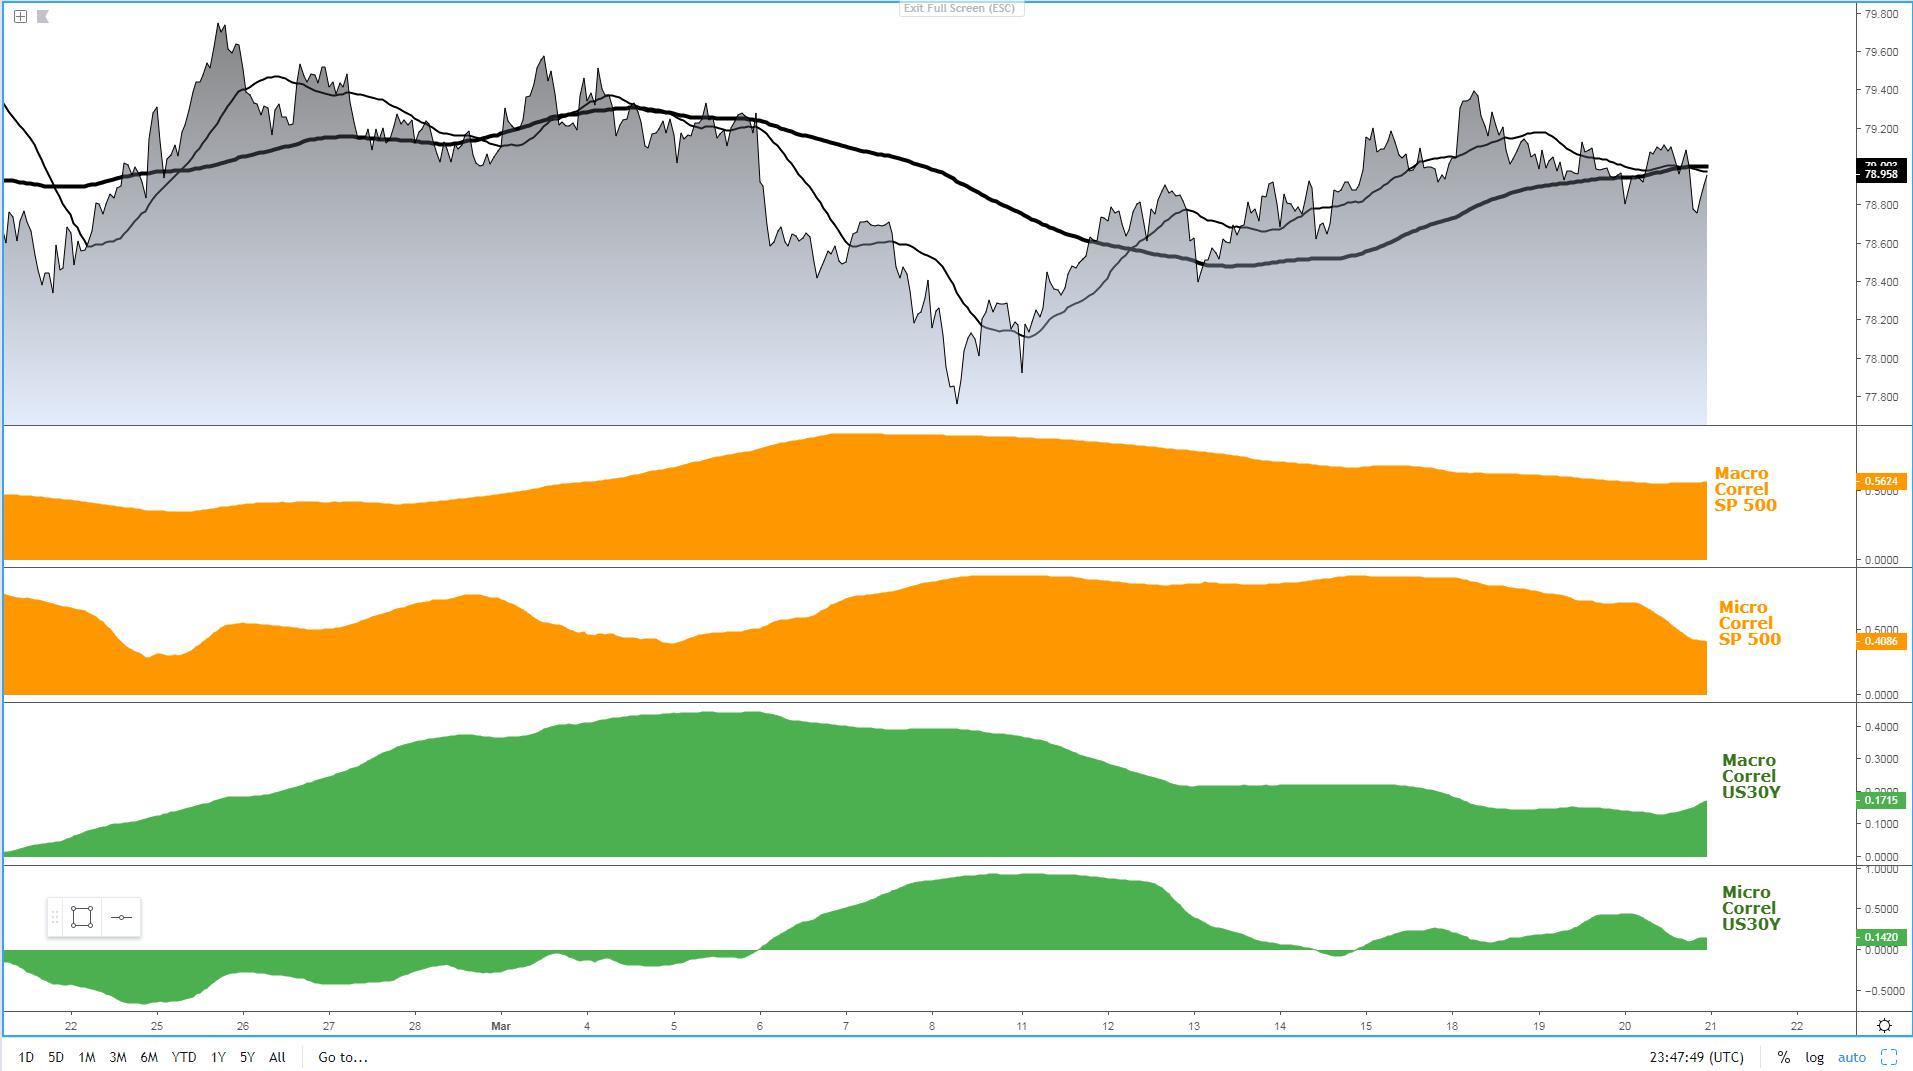
AUD/JPY: Trapped In A Range, Low Vol Trappy Pair
Trading the pair outside the Asian session (I can attest that), has been an exercise of patience and in the majority of times it feels like watching paint dry. Even since March 12th, the exchange rate has been moving in diminutive incremental bullish steps, forming range along the way, as the chart exhibits. The latest consolidation episode has market makers taking control of the 78.70-79.40 vicinity, creating an awful lot of noise in price action unless you trade at the extremes of the range. As the intermarket flows stand, we might be in the midst of a rather transient pass through the resistance level around 79.30-79.40 on the back of the Aus jobs before a reversal back down, contingent to the performance of equities. The reason can be found in the divergence between the pricing of the exchange rate and the micro slopes in the US 30y bond yield and the S&P 500, both pointing lower. Pay special attention to equities, as any resumption of the downtrend would reinforce the prospects of further range trading, while a rebond in equities, alongside USD weakness, make this market a clear contender to establish a renewed bullish momentum.
Important Footnotes
- Risk model: The fact that financial markets have become so intertwined and dynamic makes it essential to stay constantly in tune with market conditions and adapt to new environments. This prop model will assist you to gauge the context that you are trading so that you can significantly reduce the downside risks. To understand the principles applied in the assessment of this model, refer to the tutorial How to Unpack Risk Sentiment Profiles
- Cycles: Markets evolve in cycles followed by a period of distribution and/or accumulation. The weekly cycles are highlighted in red, blue refers to the daily, while the black lines represent the hourly cycles. To understand the principles applied in the assessment of cycles, refer to the tutorial How To Read Market Structures In Forex
- POC: It refers to the point of control. It represents the areas of most interest by trading volume and should act as walls of bids/offers that may result in price reversals. The volume profile analysis tracks trading activity over a specified time period at specified price levels. The study reveals the constant evolution of the market auction process. If you wish to find out more about the importance of the POC, refer to the tutorial How to Read Volume Profile Structures
- Tick Volume: Price updates activity provides great insights into the actual buy or sell-side commitment to be engaged into a specific directional movement. Studies validate that price updates (tick volume) are highly correlated to actual traded volume, with the correlation being very high, when looking at hourly data. If you wish to find out more about the importance tick volume, refer to the tutorial on Why Is Tick Volume Important To Monitor?
- Horizontal Support/Resistance: Unlike levels of dynamic support or resistance or more subjective measurements such as fibonacci retracements, pivot points, trendlines, or other forms of reactive areas, the horizontal lines of support and resistance are universal concepts used by the majority of market participants. It, therefore, makes the areas the most widely followed and relevant to monitor. The Ultimate Guide To Identify Areas Of High Interest In Any Market
- Trendlines: Besides the horizontal lines, trendlines are helpful as a visual representation of the trend. The trendlines are drawn respecting a series of rules that determine the validation of a new cycle being created. Therefore, these trendline drawn in the chart hinge to a certain interpretation of market structures.
- Correlations: Each forex pair has a series of highly correlated assets to assess valuations. This type of study is called inter-market analysis and it involves scoping out anomalies in the ever-evolving global interconnectivity between equities, bonds, currencies, and commodities. If you would like to understand more about this concept, refer to the tutorial How Divergence In Correlated Assets Can Help You Add An Edge.
- Fundamentals: It’s important to highlight that the daily market outlook provided in this report is subject to the impact of the fundamental news. Any unexpected news may cause the price to behave erratically in the short term.
- Projection Targets: The usefulness of the 100% projection resides in the symmetry and harmonic relationships of market cycles. By drawing a 100% projection, you can anticipate the area in the chart where some type of pause and potential reversals in price is likely to occur, due to 1. The side in control of the cycle takes profits 2. Counter-trend positions are added by contrarian players 3. These are price points where limit orders are set by market-makers. You can find out more by reading the tutorial on The Magical 100% Fibonacci Projection