
From SCS OTC Corp:
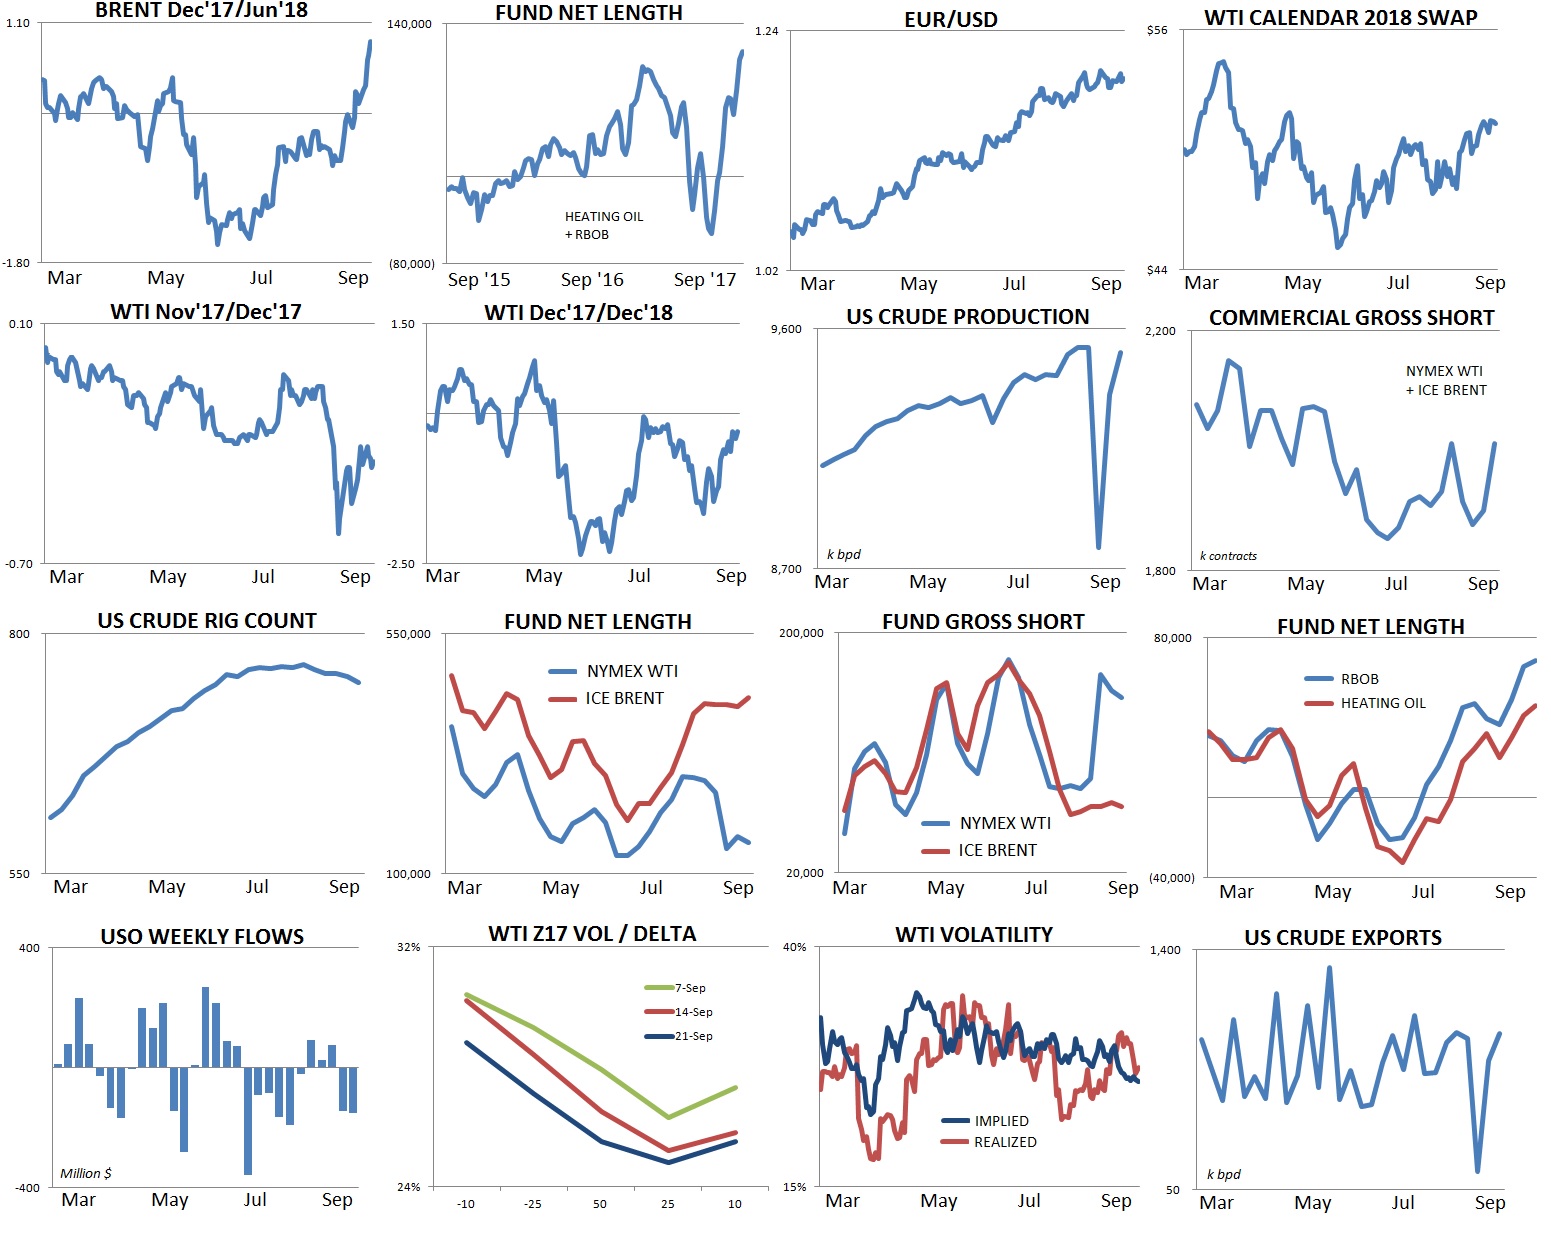
Oil markets appeared to be firing on all cylinders this week. Flat price brent reached a 5-month high on Friday at $56.91 and is +28% since June, Brent Dec’17/Jun’18 reached a 7-month high and Dated vs. Front Line Brent traded to its highest mark since mid-2014.
OPEC compliance remains strong, global refined product stocks are drawing aggressively and COT positioning on brent, gasoline and heating oil shows funds continuing to pile into the long side of the market.
– In our view the current strength in flat price, spreads and refined products looks slightly overstretched. As of Friday morning brent flat price had stochastics of 92 and a 14-day RSI of 69 after rallying 12% over the last three weeks while Brent Dec’17/Jun’18 had 87 stochastics and a 14-day RSI of 78. Positioning also looks ready to mean-revert to us with fund ICE Brent net length 1.4 standard deviations above its 2yr average while RBOB + Heating Oil fund net length is 2.4 standard deviations above its 2yr average. We see current positioning and technicals as susceptible to long-covering as PADD III and Cushing continue to work-off inventory gluts and USGC refiners are already operating at low levels due to Harvey heading into fall maintenance.
– This week’s data showed rebalance progress in several hubs with PADD 1B gasoline stocks -14% y/y, US distillate stocks -16% y/y, ARA crude stocks -10% y/y, ARA Gasoil stocks -20% y/y and Singapore distillate stocks -7% y/y.
– On a more bearish note there are still some negative pockets in what looks like a broadly tightening market. US production has snapped back from recent hurricane woes to print 9.51m bpd and is within 100k bpd of its all-time high. Producers have also aggressively hedged in Cal ’18 against the recent strength in flat price with commercial gross shorts in NYMEX WTI +44k over the last three weeks and commercial gross shorts in ICE Brent +135k contracts over the last two weeks. US crude stocks are currently 24% above their 5yr average and Cushing stocks jumped back to 59.8m bbls this week and- in our estimate- will continue to build in coming weeks.
– A strong EUR/USD also continued to support crude despite the Fed’s announcement that they will begin reducing their $4.5t balance sheet in October to the tune of $10b/mo ($6b Treasuries + $4b mortgages) on an increasing scale up to $50b/mo. Late in the week the EUR/USD traded in a technically bullish pattern near 1.1950 and the US Dollar Index plodded along near its 2.5 year low at 92.00. Markets found Yellen’s comments to be hawkish this week and Fed Fund futures implied 74% odds of a rate hike at the FOMC’s December meeting, up from just 52% last week and 38% 1-month ago.
WTI structure continues shift higher
WTI spreads remained in party-on mode this week with the prompt 1-month spread trading up to 25 cents contango for a 45-cent rally off of the post-Harvey low while WTI Z17/Z18 traded to -30 cents for a $1.30 rally off of its pre-Harvey low. In our view the prompt spread is still signaling some near term Cushing congestion with help from hurricane-reduced demand. Late week trading in Calendar Spread Options saw bullish trade group interest in Z17/F18 flat calls paying 7 cents for 2,500x while the F/G +15c traded 4 cents 5,200x. The Calendar 2018 WTI swap strengthened to a 4-month high $51.70 on Monday drawing heavy sell interest from producers.
US producer data was highlighted by a rapid recovery in US output as USGC wells continue to come back online post Harvey. US crude production printed 9.51m bpd for the week ended September 15th which is just 20k bpd shy of its recent high and a recovery of more than 700k bpd over the last two weeks. As for trade flows we’ve also seen an increase in merchant and producer gross shorts in NYMEX WTI of 44k contracts over the last three weeks and ICE brent gross shorts are +135k over the last two weeks. The US rig count fell to 744 last week which was its lowest mark since June.
Funds get bullish brent and products, retail takes profits
Hedge funds are getting bullish on brent. As of 9/12, net length in ICE brent topped 430k contracts for its highest print since March. On the WTI side, however, things are looking less aggressive with net length in NYMEX WTI at 158k contracts which is roughly 20% below its 2yr average. Increased net length in brent has come with help from a minimal gross short position in the market of just 69k contracts which gross shorts in NYMEX WTI at 152k are 33% above their 2yr average.
Funds have also gone aggressively long on NYMEX RBOB and NYMEX Heating Oil. As of September 12th the net length in RBOB stood at 69k contracts while HO net length reached 46k. The combined net length of 115k contracts is 2.4 standard deviations above its 2yr average and in our judgment looks highly susceptible to covering should cracks be revealed in the bullish-product narrative that is currently unfolding. Retail and real money investors already seem to be exercising some skepticism about the current strength of oil markets and the USO has seen a net outflow of $298m over the last two weeks.
Crude options fall on flat price rally
Prompt WTI options fell across the skew this week as flat price held gains over $50. As of Thursday afternoon WTI Z17 50d options priced at 25.6% while 25 delta puts implied 27.5% and 25 delta calls priced at 24.9%. We see 50d options lower by 1-vol w/w and by 2.5-vols over the last two weeks. Bloomberg’s crude oil option vol index the OIV fell to its lowest mark since April near 26% while realized vol fell to 27% down from 30% in the week prior.

EIA stats show tightening product outlook
- US crude oil and refined product data remains noisy due to hurricane disruptions and was lead by a 4.6m bbl overall crude build while Cushing added 700k bbls
- Crude oil exports and production have essentially snapped back to pre-Harvey levels while refiner activity is still depress
- US gasoline inventories are now lower y/y by 4% while distillate inventories are -16% y/y
US crude supplies increased by 4.6m bbls w/w to 473m bbls and are now flat y/y. PADD I inventories fell 873k bbls and are -21% y/y, PADD II stocks increased 763k bbls to +1.5% y/y, PADD III inventories gained 3.7m bbls and are flat y/y and PADD V stocks increased 1m bbls and are now -0.5% y/y. Inventories in Cushing increased by 700k bbls to 59.8m bbls. Trading flows into PADD III have normalized with exports jumping to 928k bpd while imports jumped from 1.80m bpd to 2m bpd. US crude production jumped 157k bpd to 9.51m bpd.
US refiner inputs also began to snap back last week jumping 1.1m bpd to 15.2m bpd. There is obviously still room to recover for US refiner demand with inputs about 1.5m bpd lower from their recent peak but extremely strong margins should incentivize a fast comeback in throughputs. Late in the week the WTI 321 crack traded near $20/bbl, LLS 321 traded $14/bbl and gasoil/brent traded $15/bbl- all of which should drive extremely strong demand for the foreseeable future.
US gasoline stocks fell by 2.1m bbls last week and are now lower y/y by 4%. PADD I continues to look particularly tight due to Colonial disruptions and mid Atlantic stocks are now -13% y/y. PADD II stocks added 1.3m bbls last week and are +4% y/y while PADD III stocks fell 2.4m bbls to -9% y/y. PADD V gasoline stocks added 600k bbls w/w and are -3.6% y/y. The demand side continues to work its way back from Harvey with domestic consumption printing 9.4m bpd last week while exports lagged at 544k bpd.
US distillate inventories fell by 5.7m bbls w/w and are now lower y/y by 16%. PADD IB inventories fell 1.2m bbls w/w to -31% y/y, PADD II inventories fell by 1m bbls to -7% y/y and PADD III distillate stocks fell by 3.5m bbls to a y/y deficit of 3.5%. On the west coast PADD V inventories increased by 325k bbls and are -24% y/y. Distillate production increased 570k bpd to 4.5m bpd. On the demand side, domestic consumption jumped by 200k bpd to 4.3m bpd and exports increased by 666k bpd to 1.2m bpd.
The United States Oil Fund (NYSE:USO) LP ETF (USO) closed at $10.24 on Friday, down $-0.01 (-0.10%). Year-to-date, USO has declined -12.63%, versus a 12.62% rise in the benchmark S&P 500 index during the same period.
USO currently has an ETF Daily News SMART Grade of B (Buy), and is ranked #47 of 130 ETFs in the Commodity ETFs category.