
Summary
- The stock market fell slightly last week, with the S&P 500 (SPX) down 6 points to 2665.
- While trade talks made little progress, the Fed looked a little more dovish and the President agreed to kick the shutdown can down the road.
- Our projection is for higher prices in the S&P 500, with resistance at 2722, for a period that could last a few days or a couple weeks.
Stocks fell and rose again, last week, as investors continued to digest the rebound from the December 24 lows, as I pointed out in the latest Market Week show. The focus remained on border security, the Federal Reserve, and trade talks with China. The next round of high-level talks will take place this week, led by trade representative Robert Lighthizer and vice premier Liu He. However, preparatory talks were suspended, as it appeared the Chinese were unwilling to make the structural reforms desired by the Trump administration.
While this pushed stocks lower, they later got a lift when the Wall Street Journal ran a story that the Federal Reserve was considering limiting its efforts to reduce the amount of debt on its balance sheet. The dollar index fell by 0.86% on the news.
According to Fed head Esther George, "A lot of the heavy lifting has been done. We're waiting for the committee to be satisfied that they have reached sufficient understanding of the moving pieces."
The Fed’s maximum bond reduction is $50 billion per month, which is rarely met. In December, it came to $34 billion, which added to the total of $400 billion in the reduction to this point.
After another dizzying week of political drama, President Trump felt the pressure and agreed on Friday to kick the can down the road with respect to the government shutdown. Facing an average approval rating below 40% and delays at New York’s Laguardia airport, Trump agreed to reopen the government while negotiations continue.
Turning to the macro picture, U.S. existing home sales slipped from 5.33 to 4.99 million, which was below the average analyst estimate. This was the lowest print since December 2015. As well, the IMF lowered its 2019 global growth forecast from 3.7% to 3.5%.
Finally, earnings season continued. While the majority of companies continued to beat expectations for earnings and revenue, those that revised their guidance were overwhelmingly negative in doing so, according to FactSet.
Our approach to technical analysis uses market cycles to project price action. Each week, we use this approach to forecast stock market movement.
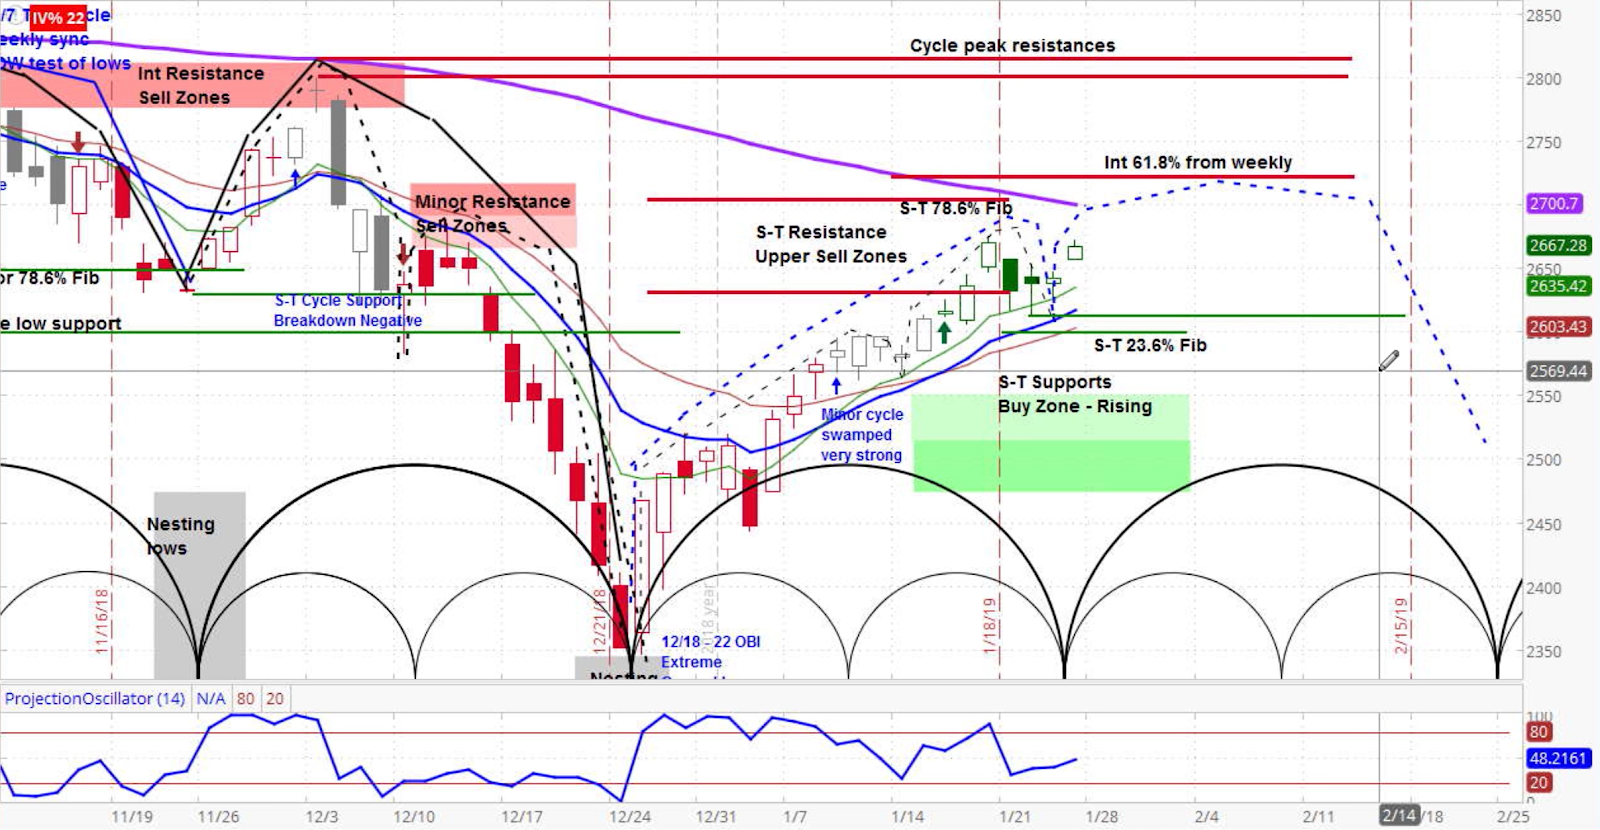
Our analysis is that the S&P 500 is in the rising phase of its current short-term and intermediate cycles. When in this configuration, odds are that stocks will continue their rise, with the potential of testing 2722 resistance, which is the level marked by the 61.8% Fibonacci extension from the weekly chart.
We expect higher price action for several days to a couple weeks. However, we are also keeping our eyes on the 2700 level, which is marked by the declining 89-day moving average. This could also function as resistance.
Finally, we have the 2612 level in mind, which is the low from the previous minor cycle. A dip below that level would be a bearish indicator.