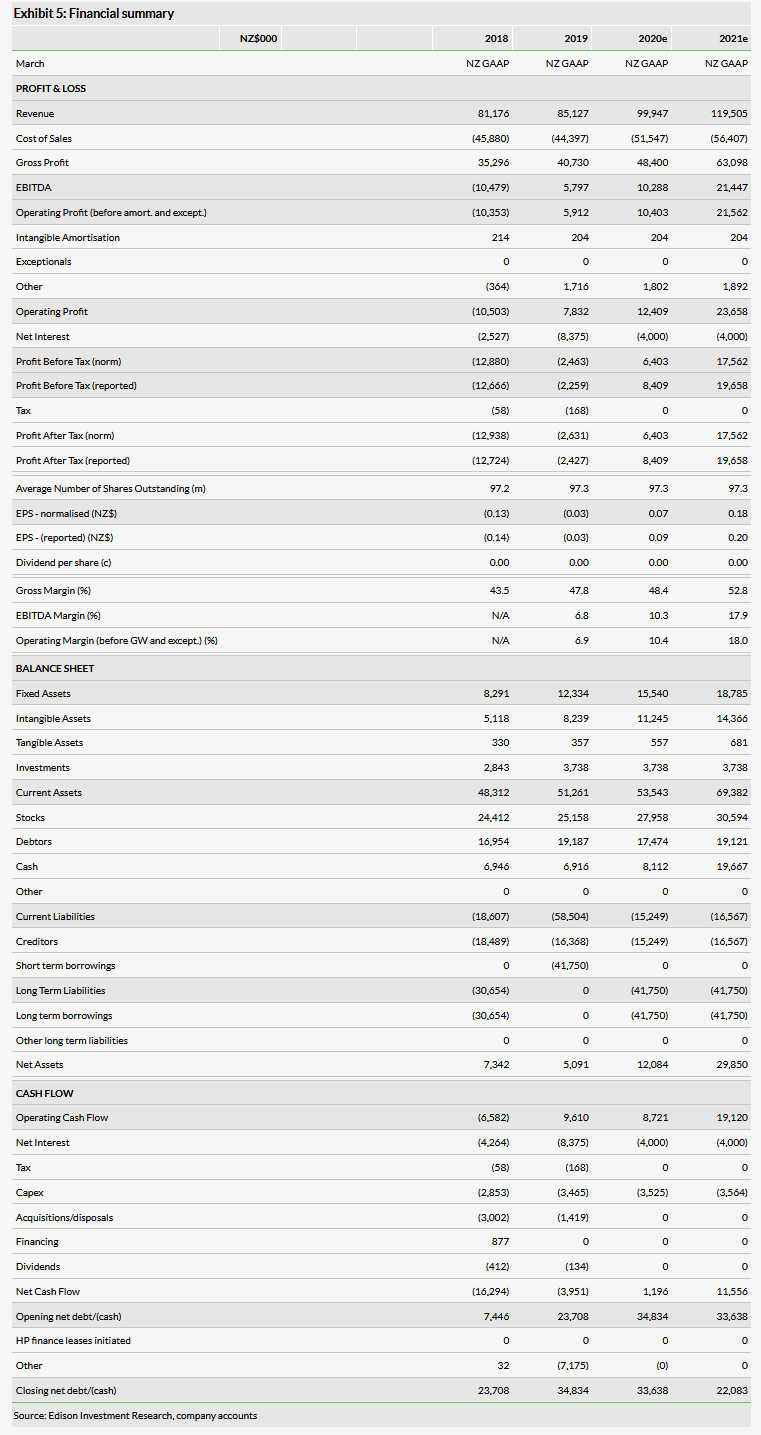
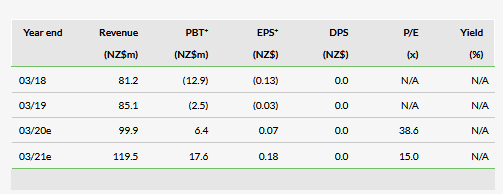
AFT Pharmaceuticals Ltd (ASX:AFP), (NZ:AFT) recently reported its FY19 results; the highlights were improving margins, as well as operating profitability for the year. Revenue grew 4.9% over 2018 while gross profit grew by 15.4% following the divestment of relatively low-margin hospital products in New Zealand and Australia. Lower SG&A and R&D spending allowed the company to report an operating profit of NZ$6.2m and the company is currently targeting an operating profit of between NZ$9m and NZ$12m for FY20.
Profitability and growth return to New Zealand
Although full year revenue in New Zealand fell by 1.1%, it grew by 5.4% after adjusting for the divested products. Also, H219 sales in the region were up 9.6% compared to H218, driven by the OTC segment, especially the allergy, pain and eyecare categories. Additionally, gross profit for the year was up 22% due to the divestment of low-margin hospital products. Operating profit for the full year swung from a loss of NZ$2.7m in FY18 to a profit of $0.5m in FY19.
Maxigesic launched in 20 countries
Rest of world revenues increased by 63.4% due to increased Maxigesic sales worldwide. Maxigesic is now sold and launched in 20 countries, up from 10 the prior year. Recent launches this calendar year include Spain and Portugal (April 2019) with launches pending in several key geographies such as France, Belgium, Eastern Europe and the Nordics.
Australia continues to grow
Revenue in Australia was up 2.3% in 2019 compared to 2018 and was negatively affected by the hospital product divestments as underlying growth when adjusting for this was 12.6%. The OTC channel grew 11%, while the hospital segment fell by 13% due to the divestments. The company expects newly launched hospital products to replace the lost revenue in FY20 but at higher margins.
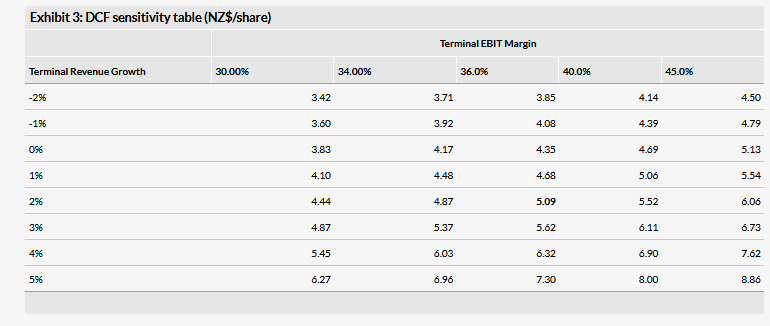
Valuation: NZ$495m or NZ$5.09 per share
We are increasing our valuation to NZ$495m or NZ$5.09 per share, from NZ$478m or NZ$4.91 per share, mainly due to improved cost controls across the business and rolling forward our NPV. This was mitigated by slightly lower revenue estimates, mainly due to a more conservative view of Maxigesic launch timing in new markets as well as slightly lower Australia estimates.
Business description
AFT Pharmaceuticals is a specialty pharmaceutical company that operates primarily in Australasia but has product distribution agreements across the globe. The company’s product portfolio includes prescription and over-the-counter drugs to treat a range of conditions and a proprietary nebuliser.
2019 results
AFT recently reported revenue of NZ$85.1m for FY19, ending 31 March 2019. This represents a 4.9% increase over FY18 and would have been larger had it not been for the divestment of relatively low-margin hospital products that were being sold in Australia and New Zealand. Importantly, gross profit grew 15.4% as gross margins improved to 47.8% from 43.5% a year ago thanks to reduced exposure to lower-margin products as well as high growth in the higher-margin over-the-counter (OTC) segment. What seems especially noteworthy is that while revenues increased by NZ$4.0m compared to 2018, cost of goods actually fell by NZ$1.5m over the same period. Also, in total, SG&A and R&D expenditures fell by 19.4% to NZ$36.3m mainly due to lower R&D spending following the completion of the pivotal trial of Maxigesic IV. These across the board cost controls greatly improved profitability as the company swung from a reported operating loss of NZ$10.1m to a profit of NZ$6.2. The company is currently targeting an operating profit of between NZ$9m and NZ$12m for FY20.

Revenue in Australia was up 2.3% in 2019 compared to 2018 and was negatively affected by the hospital product divestments as underlying growth when adjusting for this was 12.6%. The OTC channel grew 11%, which may be undercounting the organic growth rate as there was stocking at pharmacies at the end of FY18 ahead of the rescheduling of codeine products. The hospital segment fell by 13% due to the divestments but the company expects newly launched hospital products (such as the antibiotic Piptaz (Piperacillin/tazobactam)) to replace the lost revenue in FY20 but at higher margins.
Full year revenue in New Zealand fell by 1.1% though it grew by 5.4% after adjusting for the divested hospital products. Additionally, H219 sales were strong in the region as they increased 9.6% compared to H218. This growth was driven by the OTC segment, especially the allergy, pain and eyecare categories. Gross profit for the year was up 22% due to the divestment of low-margin hospital products. All of these factors combined led operating profit for the area to swing from a loss of NZ$2.7m in FY18 to a profit of $0.5m in FY19.
Maxigesic launch and pipeline update
Maxigesic is now sold and launched in 20 countries, up from 10 the prior year. Recent launches this calendar year include Spain and Portugal (April 2019) with launches pending in several key geographies such as France, Belgium, Eastern Europe and the Nordics. There are distribution agreements in place in over 125 (Switzerland and Cyprus are recent additions) with a key focus on signing distribution agreements in the US, Canada, Germany and parts of South America, such as Brazil, with discussions beginning or already underway in those countries.

Maxigesic IV is progressing with licensing agreements in 68 countries. The first approval is expected in FY20. In the US, Maxigesic IV is moving closer to filing. Following a pre-NDA meeting with the FDA, the company believes it needs to do some additional clinical work on the product although it expects to complete this relatively quickly. We expect a filing in H120 (previously, our expectation was for a filing in 2019). The company has also submitted the data from the Maxigesic IV pivotal study to a major journal for publication, which should help increase its profile. We continue to view IV Maxigesic as a big opportunity as Mallinckrodt (NYSE:MNK) sells an IV formulation of paracetamol/acetaminophen (just one component of the paracetamol/acetaminophen and ibuprofen combination that is Maxigesic) in the US which had $341.9m in sales in 2018. Hence there is potential for meaningful upfront payments from a licensing agreement with a US partner.
With regards to NasoSURF, human factor studies for the product have largely been completed following some device redesign. Clinical trial work is expected to start at the end of FY20. On Pascomer, initiation of a Phase II/III study is being planned and partnership discussions are underway to help fund development.
Valuation
We are increasing our valuation to NZ$495m or NZ$5.09 per share, from NZ$478m or NZ$4.91 per share, mainly due to improved cost controls across the business and rolling forward our NPV. This was mitigated by slightly lower revenue estimates, mainly due to a more conservative view of Maxigesic launch timing as well as slightly lower Australia estimates.
Financials
We have decreased our revenue estimates to NZ$99.9m from NZ$109.5m for FY20, driven mainly by lower Australia and rest of world estimates as both came in a bit lower than expected (though still grew 64.4%). We have also decreased our SG&A expense estimates for FY20 by NZ$4.9m due to a lower than expected run rate. Additionally, we have reduced our R&D expense estimates by NZ$0.9m for FY20 as R&D expenses have fallen faster than expected. Our FY20 EBITDA estimate is down NZ$1.6m and our estimate for profit before tax has been reduced by NZ$3.6m mainly due to higher than expected finance costs. We are introducing FY21 estimates, which include revenues of NZ$119.5m, 19.6% growth over our FY20 estimate (coming mainly from Australia and rest of world). Also note that due to the new IFRS reporting requirement, licensing income is now included in revenue and 2018 has been restated to account for this.
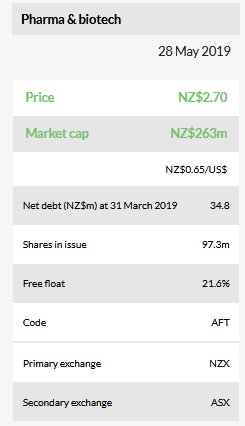
The company reported a cash position of NZ$6.9m at the end of 2019 after drawing down an additional NZ$7.4m from the Capital Royalty Group (CRG) facility over the course of the year and now owes NZ$41.7m in the US-denominated debt (which grew by NZ$1.9m due to US dollar strength during 2019), that is due 31 March 2020. CRG has offered to extend the loan but the company has decided to pursue a long-term facility from New Zealand commercial banks to repay CRG. To that end it has established a NZ$15m interim banking facility with the Bank of New Zealand, which it will use to repay part of the CRG facility, starting with a US$9.5m payment over the next few days. Although the interim facility also expires on 31 March 2020, it carries a lower interest rate compared to the 13.5% for the CRG facility so should help the company save some financing costs as the company negotiates a longer-term financing deal.

