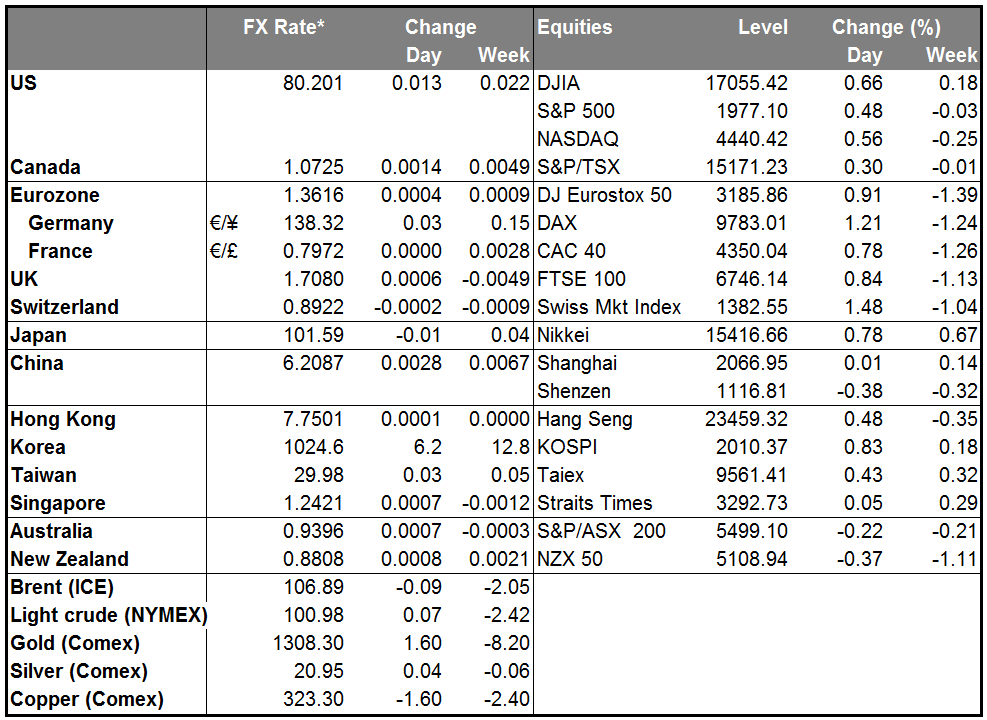
The action is in commodities, not currencies
Currencies moved in a narrow range yesterday. Within the USD moved only ±0.1% or more against four G10 currencies, falling vs CAD and rising vs NZD, JPY and GBP. Commodities were more volatile. Gold and silver, which fell in late European trading Monday, failed to register any bounce, while corn, wheat and several other agricultural commodities fell further. Traders looking for volatility might want to look at those markets, although as prices there are determined largely by the weather and my training is in economics, I have little insight to share about them.
There was no news to push CAD higher; it just rebounded a bit after Friday’s steep fall as traders positioned ahead of Wednesday’s Bank of Canada rate decision.
The statement following the July 1st Reserve Bank of Australia (RBA) meeting was virtually unchanged from the previous month, so I did not expect any new revelations from the minutes of the meeting, released overnight. As expected, the minutes also showed little change in the RBA’s tone and AUD/USD opened today in Europe a mere 1 pip off of yesterday’s opening price. I agree with RBA Gov. Stevens, who has said that the AUD “is overvalued, and not just by a few cents.” I expect AUD to trend lower as commodity prices decline further.
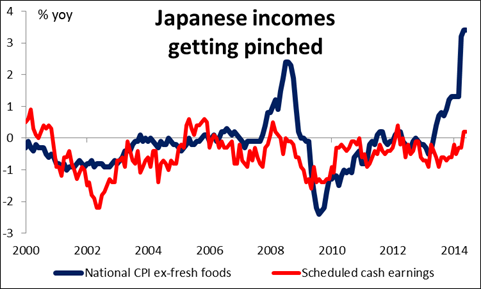
The Bank of Japan held its Policy Board meeting overnight and it too made no change to its scenario. It kept its stimulus unchanged and Board members estimated that consumer prices (excluding fresh foods) would rise 1.9% in the year starting April 2015, the same as their forecast three months ago. Prices by that measure rose 3.4% in the year to May, well above the BoJ’s 2% target, but that includes the impact of the 2 percentage-point hike in the consumption tax. Before the hike it was rising 1.3% yoy, suggesting that there is still some ways to go before prices reach their target. I don’t think it’s likely to hit that level unless the yen falls further. Earnings are still rising less than prices, meaning consumer purchasing power is diminishing. That makes demand/pull inflation unlikely. The only alternative is cost/push inflation. With energy prices falling, the only way to engineer that is to weaken the currency further. I expect some action from the BoJ along those lines later this year. USD/JPY was higher this morning, but not necessarily in reaction to the meeting; rather, the gains came largely during early US trading as US stocks moved higher.
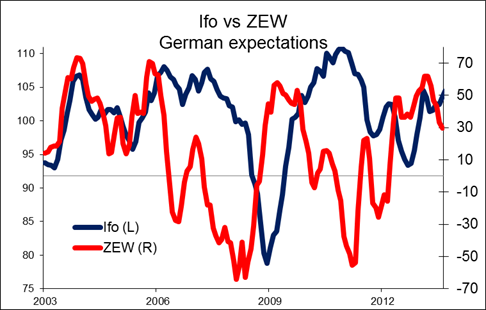
Today: During the European day, the main event will be the German ZEW survey for July. The current situation index is expected to decline to 67.4 from 67.7 and the expectations index is anticipated to have fallen to 28.2 from 29.8 the previous month. The forecast of the weakening indices adds to the recent signs of a slowdown in the Eurozone’s recovery.
In the UK, the CPI is forecast to have risen by +1.6% yoy in June from +1.5% yoy in May, while the nation’s PPI for the same period is forecast to have remained unchanged at +0.5% yoy pace.
In the US, Fed Chair Janet Yellen will take center stage with her testimony to Senate on the semiannual monetary policy report. Her prepared remarks are usually based on previously announced Fed reports and so usually contain little of interest. Attention will focus on the question and answer session that follows her presentation. With the FOMC releasing its own forecasts on a quarterly basis, these there is less for the Chair to reveal than there used to be, but her comments still have the power to move markets. Following the June FOMC meeting, she said that “(r)ecent readings on, for example, the CPI index have been a bit on the high side,” but added that the data are “noisy.” The market focused on this dismissal of inflation fears rather than the rise in the FOMC’s forecasts for interest rates and interest rate expectations actually fell. Investors will be keen to hear whether she still has the same view on inflation that she did a month ago, and also any hints she might give about when the Fed would begin raising rates.
As for US indicators, retail sales for June are forecast to have accelerated to +0.6% mom from +0.3% mom, while retail sales excluding the volatile items of auto and gasoline are expected to have been up 0.4% mom, from 0.0% mom of the previous month. The Empire State manufacturing survey for July is also coming out.
Besides Fed Chair Yellen, we have five more speaker scheduled on Tuesday’s agenda. ECB Governing council member Christian Noyer speaks and BoE’s Governor Mark Carney, Deputy Governor Andrew Bailey and Financial Policy Committee members Donald Kohn and Martin Taylor testify to the House of Commons.
The Market
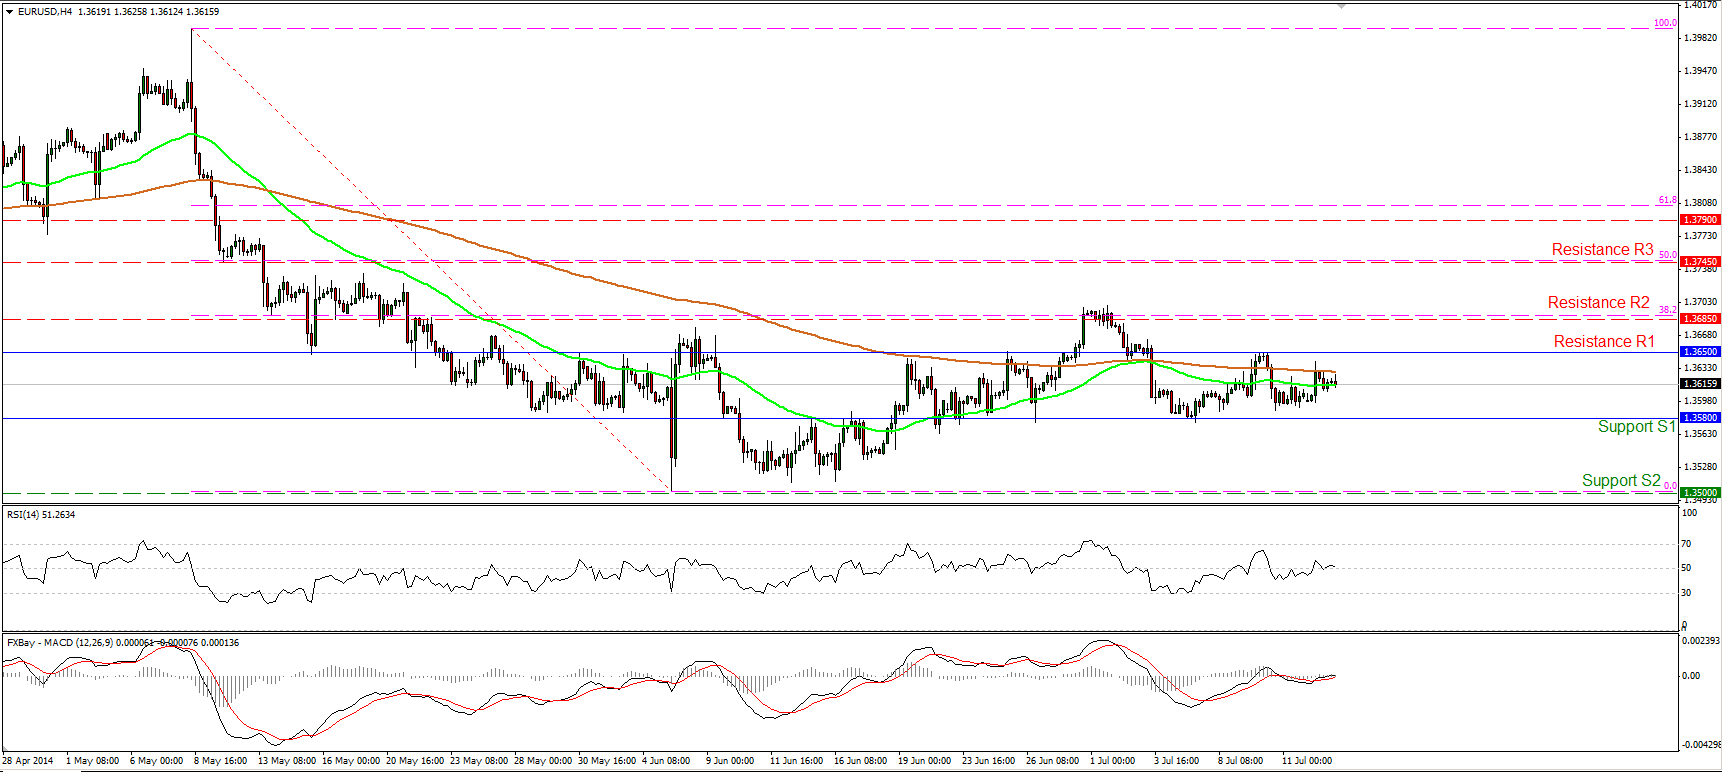
EUR/USD keeps the picture neutral
The EUR/USD edged marginally higher, remaining near the two moving averages, between the support zone of 1.3580 and the resistance of 1.3650 (R1). Taking this into account and that both the 50- and the 200-period moving averages are pointing sideways, I would maintain my neutral stance today. Only a dip below 1.3580 (S1) could confirm a forthcoming lower low and trigger further bearish extensions. I would expect such a dip to pave the way towards the psychological barrier of 1.3500 (S2). On the daily chart, both the 14-day RSI and the daily MACD remain near their neutral levels, supporting my flat view, at least for now.
• Support: 1.3580 (S1), 1.3500 (S2), 1.3475 (S3)
• Resistance: 1.3650 (R1), 1.3685 (R2), 1.3745 (R3)
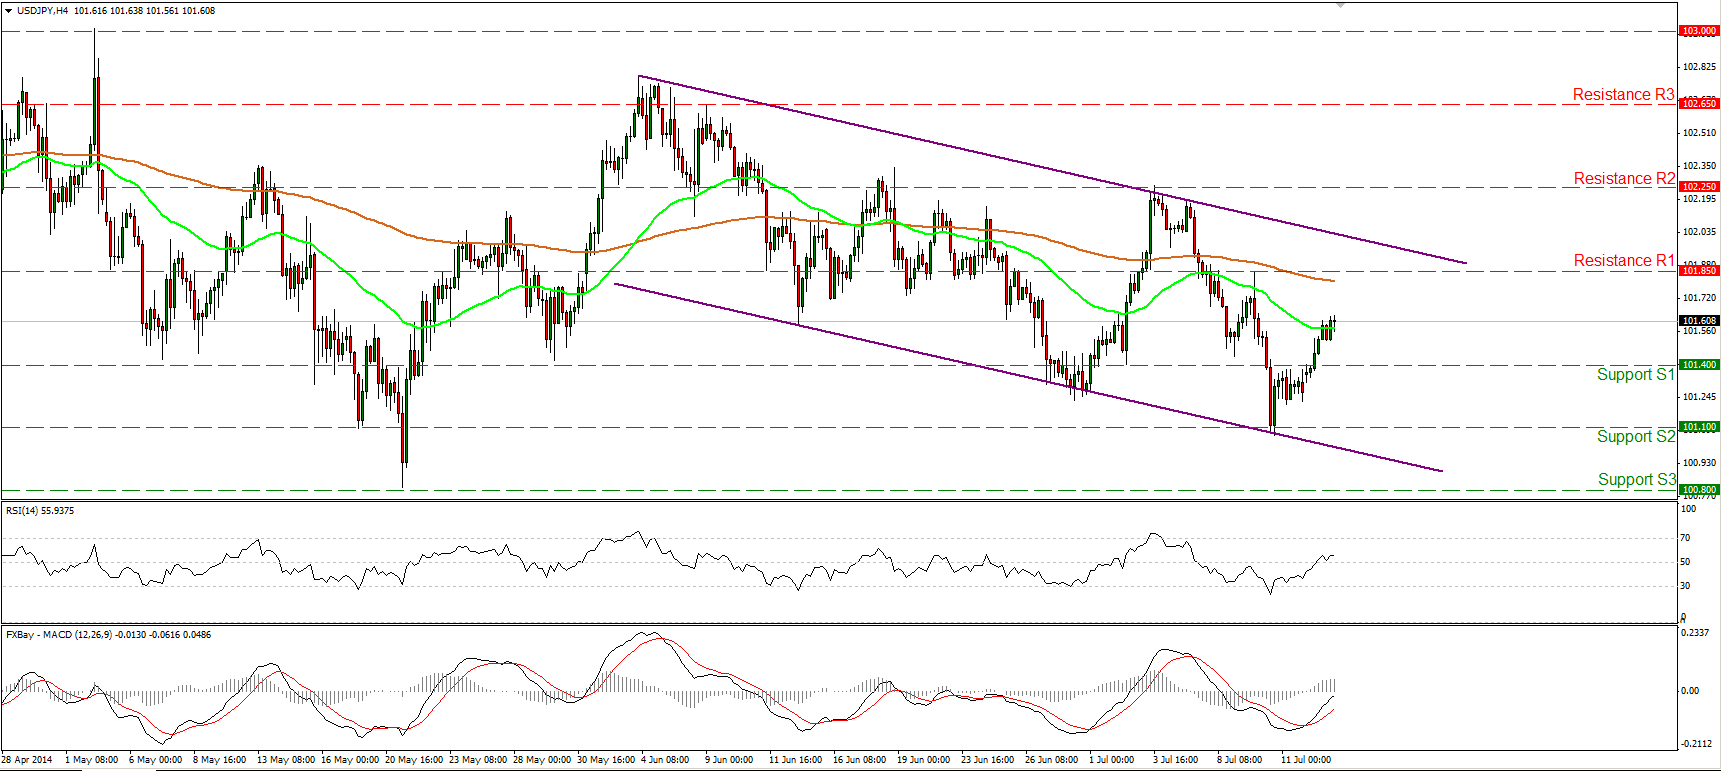
Are USD/JPY bulls going for 101.85?
The USD/JPY moved significantly higher after finding support at 101.10 (S2), last week. The rate emerged above the 101.40 barrier and I would expect the upside to continue towards the resistance of 101.85 (R1) or towards the upper boundary of the purple downward sloping channel. The MACD lies above its signal line and seems ready to obtain a positive sign soon, while the RSI crossed above its 50 level, magnifying the case for the continuation of the upside wave. However, the pair is trading within the purple downside channel and as a result, the overall short-term path remains to the downside. On the daily chart, I can see a morning star candle pattern favoring further upside correction.
• Support: 101.40 (S1), 101.10 (S2), 100.80 (S3)
• Resistance: 101.85 (R1), 102.25 (R2), 102.65 (R3)
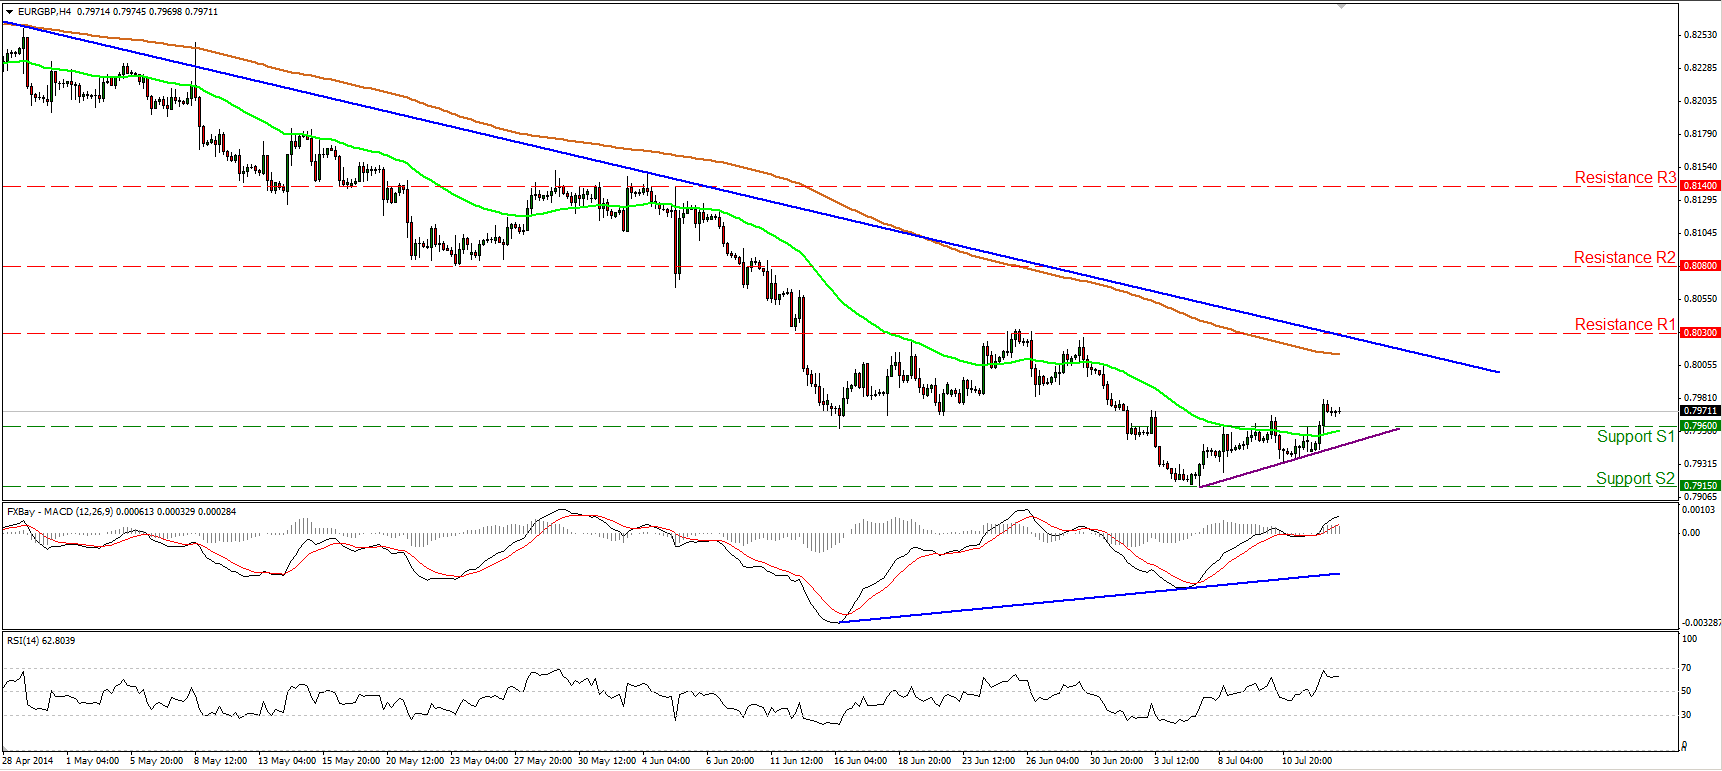
EUR/GBP in a correcting mode
The EUR/GBP continued moving higher, confirming the bullish engulfing candle pattern identified on the daily chart and the positive divergence between our momentum studies and the price action. The pair violated the resistance zone (turned into support) of 0.7960 (S1) and thus I would expect the advance to continue, perhaps towards the blue downtrend line or the 0.8030 (R1) hurdle. Nevertheless, as long as the pair is forming lower highs and lower lows below the blue downtrend line drawn from back the 11th of April, I consider the overall outlook to be to the downside and any further advances as renewed selling opportunities. Only a decisive move above 0.8030 (R1) would be a reason to reconsider our analysis
• Support: 0.7915 (S1), 0.7830 (S2), 0.7760 (S3)
• Resistance: 0.7960 (R1), 0.8030 (R2), 0.8080 (R3)
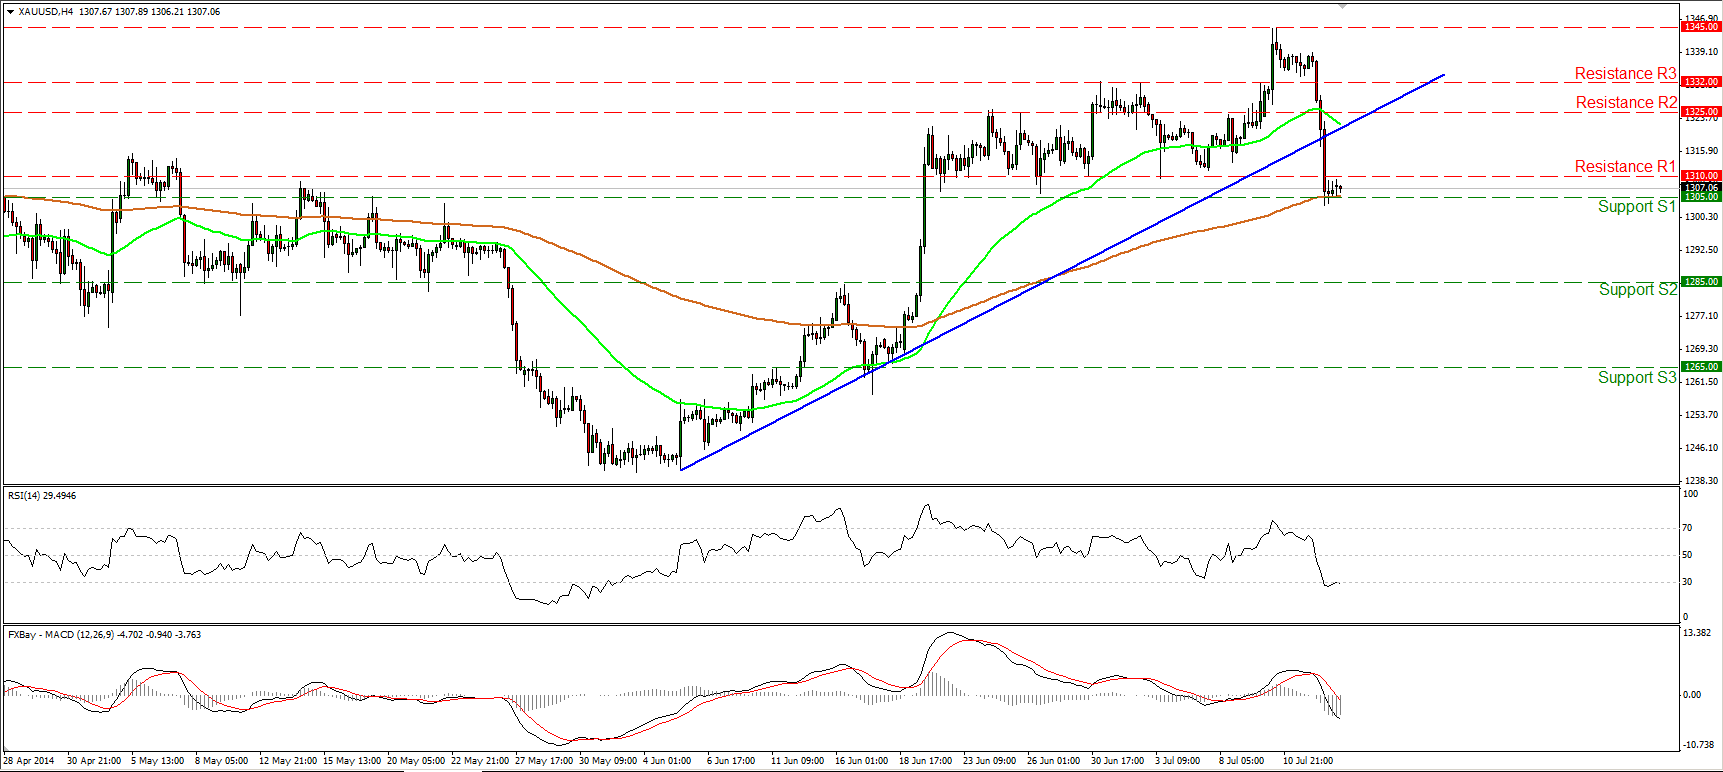
Gold tumbles, breaking the uptrend line
Gold collapsed on Monday, breaking below the blue uptrend line, drawn from back the 5th of June. Nevertheless, the plunge was halted by the support zone of 1305 (S1) and the 200-period moving average. The MACD lies below both its signal and zero lines, confirming yesterday’s negative momentum. Although we may experience further declines, I would wait for a clear move below that strong support zone to trigger further extensions and perhaps target the 1285 (S2) barrier. On the daily chart, the 1305 (S1) barrier is near the 50-period moving average, corroborating my view that a break below 1305 (S1) is needed for further declines.
• Support: 1305 (S1), 1285 (S2), 1265 (S3)
• Resistance: 1310 (R1), 1325 (R2), 1332 (R3)
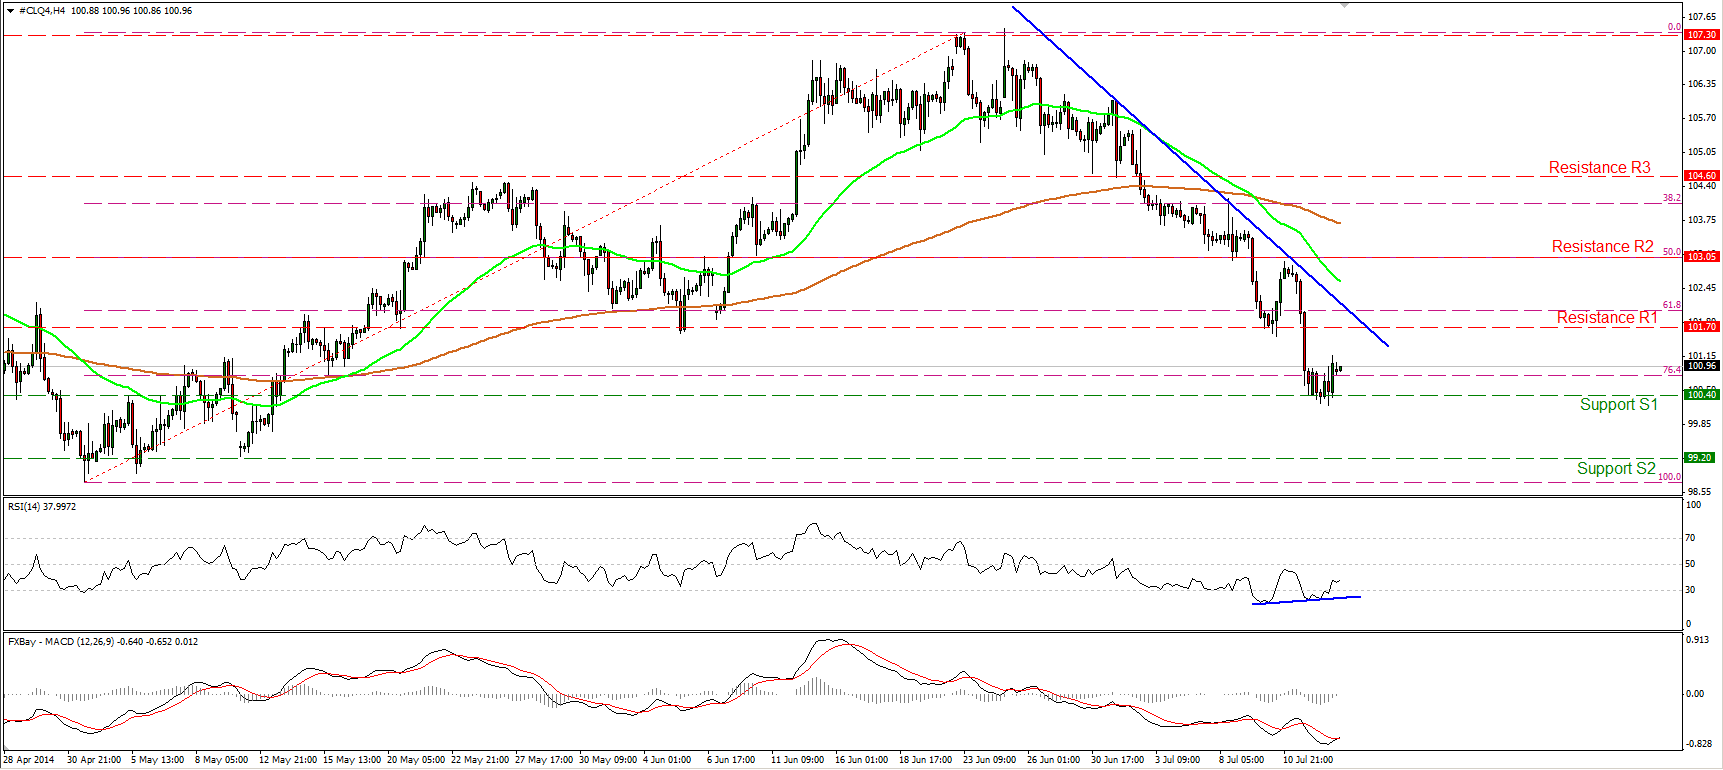
WTI bounces from 100.40
WTI moved somewhat higher on Monday, supporting our expectations for a forthcoming bounce from the support zone of 100.40 (S1). Seeing that the RSI moved higher after exiting its oversold field and that the MACD crossed above its signal line, I would expect the upside wave to continue. Additionally, I can identify positive divergence between the RSI and the price action, amplifying the case for further advances, maybe for a test at the 101.70 (R1), area as a resistance this time. Nevertheless, the price structure remains lower peaks and lower troughs below both the moving averages and below the blue downtrend line. Bearing this in mind, I still see a downtrend and I would consider any further advances as a correcting wave, at least for now. Only a move above 103.05 (R3) could signal a forthcoming higher high and flip the picture positive.
• Support: 100.40 (S1), 99.20 (S2), 98.75 (S3)
• Resistance: 101.70 (R1), 103.05 (R2), 104.60 (R3)

