Get 40% Off
👀 👁 🧿 All eyes on Biogen, up +4,56% after posting earnings. Our AI picked it in March 2024.
Which stocks will surge next?
Unlock AI-picked Stocks

Tarnished Outlook For Silver

Published 06/25/2019, 12:30 AM
Updated 07/09/2023, 06:31 AM

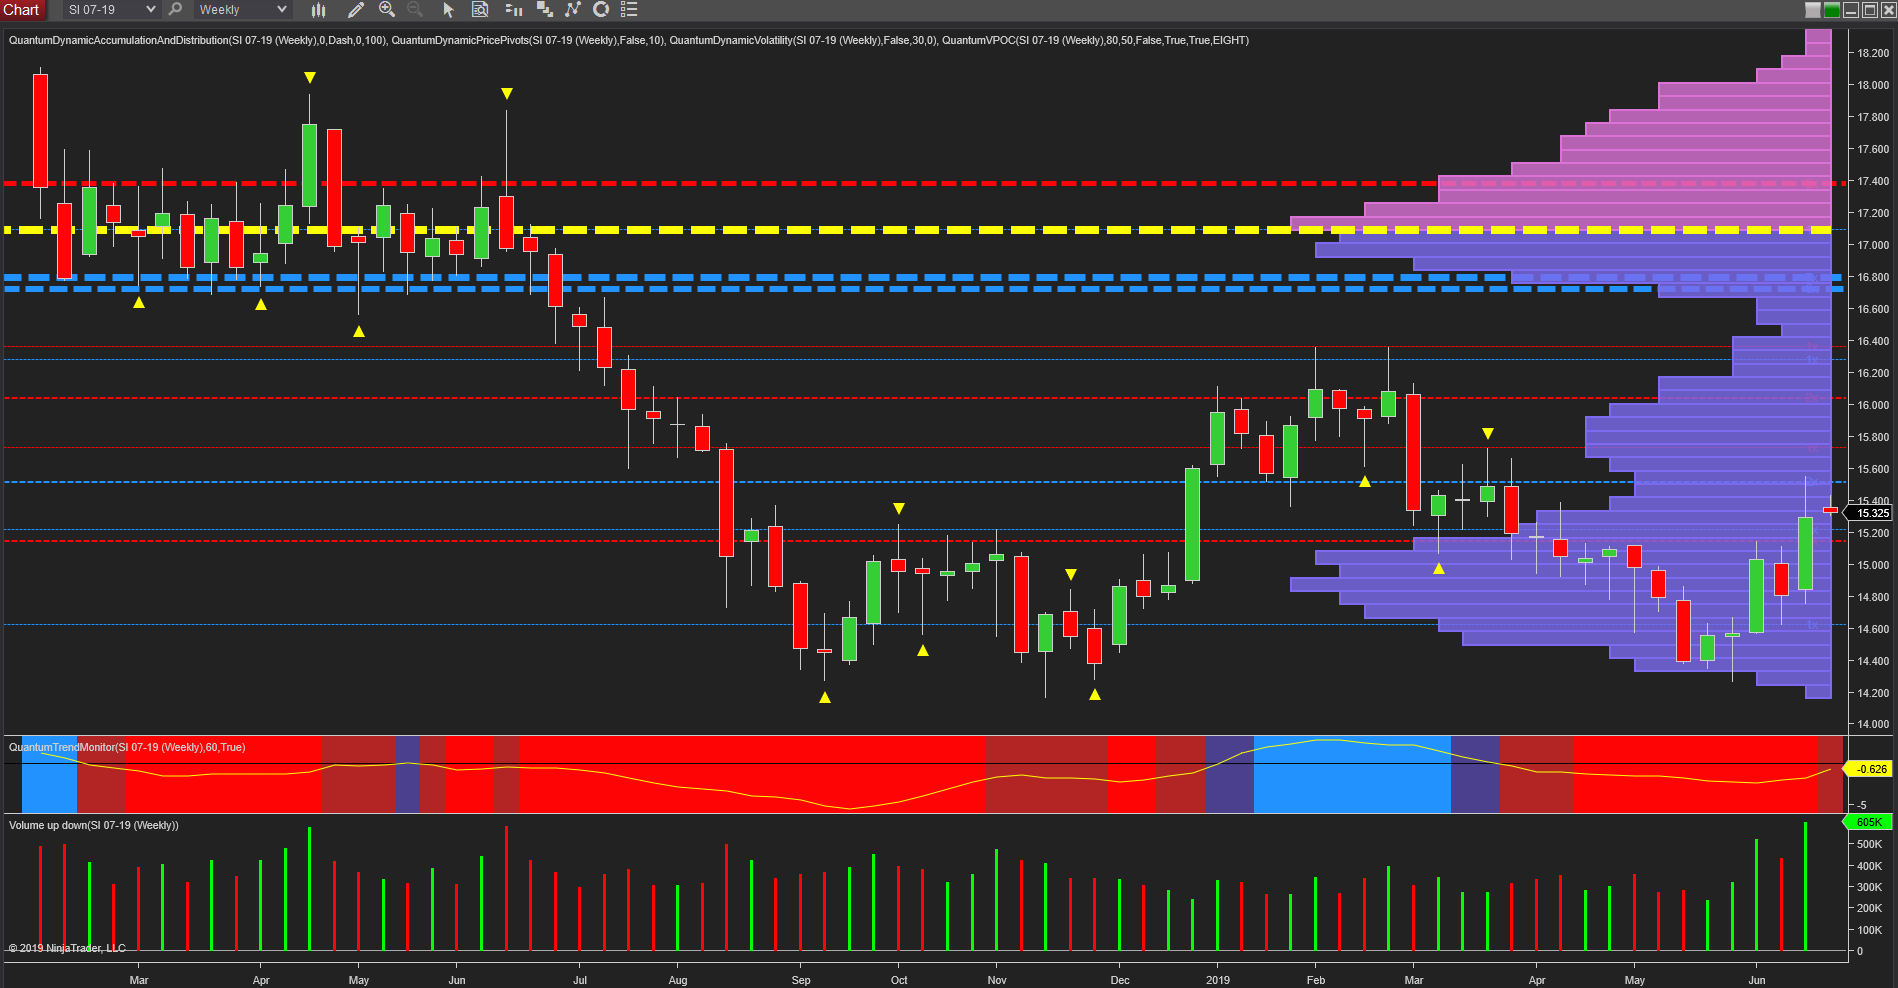
Silver Weekly Chart

It’s always interesting to follow any analysis of gold with that for silver, and for alternative investors, the picture here is less rosy with the industrial metal continuing to trade in a tight range, and yet to develop any longer term bullish momentum. In addition, any return to a longer term trend higher has some serious barriers to overcome on the weekly timeframe.

If we begin with last week’s price action, the candle itself closed with a deep wick to the upper body on good volume, suggesting a degree of selling as the metal hit minor resistance in the $15.50 per ounce area as denoted with the blue dashed line of the accumulation and distribution indicator. This weakness continued in yesterday’s trading, and whilst silver opened gapped up, as did gold, there has been no equivalent follow-through in bullish sentiment with trading confined to a narrow range.

Between $15.60 per ounce and $16.00 per ounce we also have a high volume node on the volume point of control histogram to the right of the chart, so any move through here will require support volume to push the metal through this tough area, which once penetrated will then open the door to light volume to $16.80 per ounce.

However, at this price region problems begin again as we have two extremely strong regions of price based resistance in a cluster as denoted with the blue dashed lines of the accumulation and distribution indicator. These are immediately followed by the volume point of control itself denoted by the yellow dashed line and representing the deepest concentration of transacted volume. Finally at $17.40 per ounce we have yet another deep area of price resistance denoted with the red dashed line, before volume then falls away as we move into clearer waters above and through the $18 per ounce and above.

3rd party Ad. Not an offer or recommendation by Investing.com. See disclosure here or remove ads .

The last of these levels seems an awfully long way away, and for silver to reach these heady heights will require sustained and rising volume to drive the metal through the immense barriers now ahead. And even if this does occur, dragged higher by gold, progress is likely to be slow and labored, and at the very least, we can expect to see an extended congestion phase develop at the $17.10 per ounce area if silver does manage to claw its way higher.

Either way, whether for investors or speculative day traders, there are likely to be much better opportunities in other markets for the immediate future.

Latest comments

Silver plays catch up after Jul contract expires today. This article is going to look cery silly bybfriday.
Oh why am I asking about your motives ,, I should have seen the title of your previous article with the word "gold bugs" in it ,,, all is clear now ..
Interesting to write all this article about silver then finish it off with "for investors or traders may be better opportunities elsewhere " .... why go through all the analysis and price levels then ? Trying to Put off investors from a market for some reason?
Risk Disclosure: Trading in financial instruments and/or cryptocurrencies involves high risks including the risk of losing some, or all, of your investment amount, and may not be suitable for all investors. Prices of cryptocurrencies are extremely volatile and may be affected by external factors such as financial, regulatory or political events. Trading on margin increases the financial risks.
Before deciding to trade in financial instrument or cryptocurrencies you should be fully informed of the risks and costs associated with trading the financial markets, carefully consider your investment objectives, level of experience, and risk appetite, and seek professional advice where needed.
Fusion Media would like to remind you that the data contained in this website is not necessarily real-time nor accurate. The data and prices on the website are not necessarily provided by any market or exchange, but may be provided by market makers, and so prices may not be accurate and may differ from the actual price at any given market, meaning prices are indicative and not appropriate for trading purposes. Fusion Media and any provider of the data contained in this website will not accept liability for any loss or damage as a result of your trading, or your reliance on the information contained within this website.
It is prohibited to use, store, reproduce, display, modify, transmit or distribute the data contained in this website without the explicit prior written permission of Fusion Media and/or the data provider. All intellectual property rights are reserved by the providers and/or the exchange providing the data contained in this website.
Fusion Media may be compensated by the advertisers that appear on the website, based on your interaction with the advertisements or advertisers.
© 2007-2024 - Fusion Media Limited. All Rights Reserved.