AT40 = 14.6% of stocks are trading above their respective 40-day moving averages (DMAs) (day 2 oversold)
AT200 = 31.4% of stocks are trading above their respective 200DMAs (near 2-year low)
VIX = 29.1 (range from 27.7 to 41.1)
Short-term Trading Call: bullish
Commentary
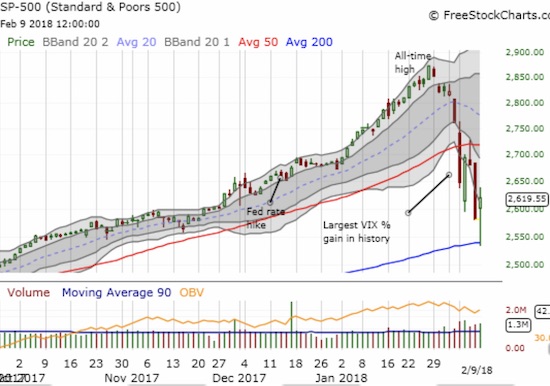
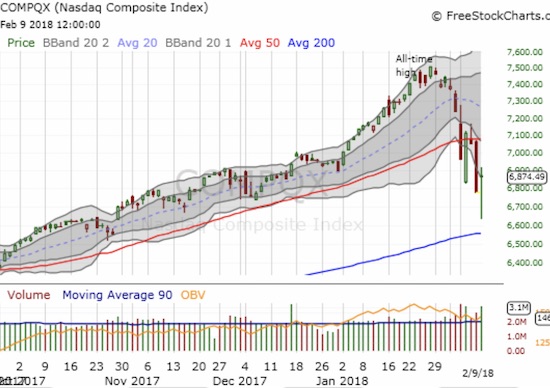
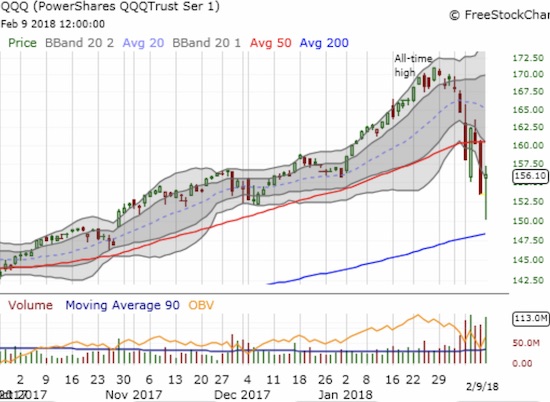
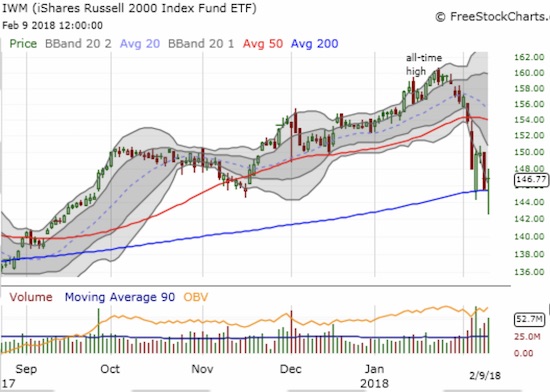
Friday’s classic battle between buyers and sellers delivered a (short-term?) market reset – a potential point where sellers have thrown out just about everything they no longer want, and where buyers feel like merchandise is too cheap to pass up. The S&P 500 (via SPDR S&P 500 (NYSE:SPY)) bounced in picture-perfect style off support at its 200-day moving average (DMA). The NASDAQ and the PowerShares QQQ ETF (NASDAQ:QQQ) bounced sharply off their lows but did not quite complete a test of 200DMA support. The iShares Russell 2000 ETF (NYSE:IWM) struggled with its 200DMA support last week; on Friday, it punched through for the second time only to bounce back strong.
The S&P 500 (SPY) made a gold medal leap off its 200DMA support.
The NASDAQ travelled far but did not quite touch its 200DMA before bouncing.
Like the S&P 500 and the NASDAQ, the PowerShares QQQ ETF (QQQ) bounced sharply and closed right at its lower-Bollinger Band (BB).
The iShares Russell 2000 ETF (IWM) tested 200DMA support three out of the last four trading days. The last test came precariously close to a bearish breakdown.
Of these indices, the NASDAQ and QQQ are most likely to break last week’s low in the next near-term sell-off as the key 200DMA supports technically remain untested. However, it should take a swell of stubborn selling pressure to push these indices, and the other major ones, down from their lower-Bollinger Bands (BB) once again during oversold trading conditions.
AT40 (T2108), the percentage of stocks trading above their respective 40DMAs, dropped as low as 8.6% before closing at 14.6%. AT40 last traded that low during the January, 2016 sell-off. It is indicative of the broad-based selling and widespread market fear that held AT40 to its second day in oversold territory (below 20%).
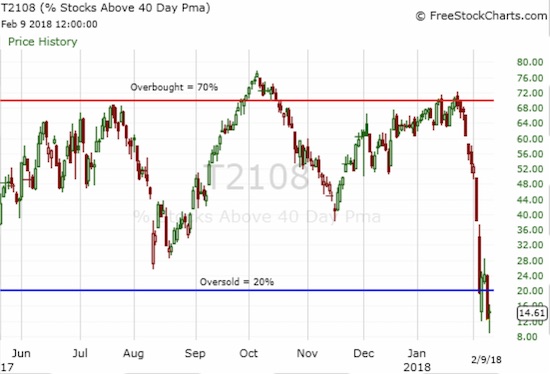
AT40 (T2108) plunged deep into oversold territory at the market lows. Even the subsequent rally could not end the oversold period.
AT200 (T2107), the percentage of stocks trading above their respective 200DMAs, closed at 41.4% after going as low as 34.7%. While this level did not penetrate last August’s intraday low, the current breakdown in T2107 effectively re-established the downtrend that was in place from September, 2016 to the small breakout last month. This trend bears watching once a market (relief?) rally gets underway as it could represent a hard cap for the market for some time to come.
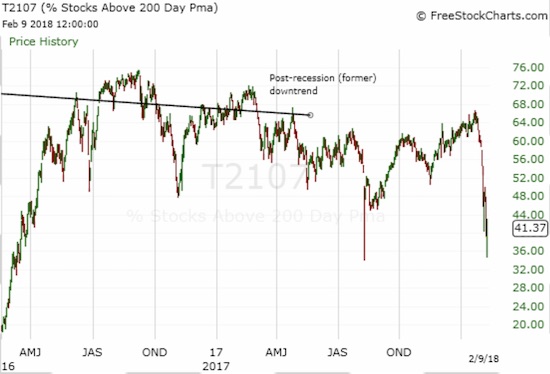
AT200 (T2107) demonstrates the widespread damage done to long-term trends. Last Monday, over 50% of stocks suffered bearish long-term breakdowns. For the rest of the week, the market failed to recover the 50% line.
The volatility index, the VIX, remains the center of attention. The fear gauge got as high as 41.1% before fading to a close of 29.1. This was the third fade out of the last 5 trading days. So while the VIX remains high, the willingness of fear to stay aloft appears to be weakening. Fear looks ready to cede control to a market reset.
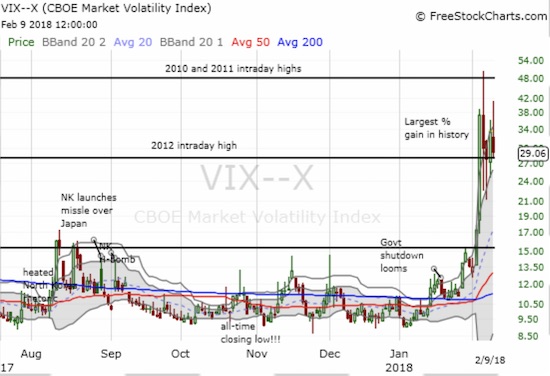
A historic run-up for the VIX in February is bracketed by important intraday highs from 2010 to 2012.
I did not get the gap down that I wanted to switch me to an aggressively bullish trading strategy, but the S&P 500’s bounce off its 200DMA while in oversold conditions was good enough for a few buys. The 5-minute chart of the S&P 500 shows that sellers chose a steady and gradual approach to dumping more stocks overboard after they got higher prices in the first 2 1/2 hours of trading.
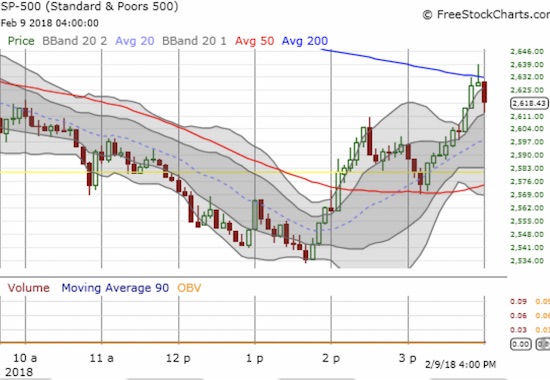
Buyers stepped in during the first 30 minutes of trading. Sellers took the market back down for the next 3 hours. Buyers took two swipes around the 200DMA before they could take over the action. (Yellow line represents the previous day’s close).
I did nothing for the first hour of trading, wary because the market failed to deliver a washout moment. After that wait, I focused on the S&P 500 and individual stocks at key support and resistance. I bought a calendar call spread on SPY, added calls to an existing position, and loaded up on shares. I sold the shares at the close because I suspected I was carrying too much risk given the lack of a clear washout moment. If a retest of 200DMA support happens, I will get incrementally more aggressive. Of course, if selling continues from there, then I will have to consider the impact of the potential bearish turn of events on my trading strategies. Still, with the market deeply oversold, I do not expect a 200DMA breakdown without first a relief rally that exhausts the fresh buying powder of bulls.
I added to my Intel (NASDAQ:INTC) call options. I also gulped hard and kicked off another round of weekly calls for Apple (NASDAQ:AAPL). I still think AAPL’s 200DMA breakdown is bearish for the stock (and will help weigh on the market), but I am looking for another test of the 200DMA as resistance. My only shares on an individual stock came with Open Text Corp (NASDAQ:OTEX) which bounced off 50DMA support and completed a reversal of its bullish post-earnings gap up.
Again, I was not nearly as aggressive as I would have liked given the lack of a true washout event. If the market keeps rallying without such a washout, I will then look for the buyers to demonstrate some convincing show of force after AT40 exists oversold trading conditions.
On the short side, I locked in profits on my BHP Billiton (LON:BLT) Ltd ADR (NYSE:BHP) put options (per my expectation of a top in iron ore, I will fade the next rally). I ADDED a short on iShares Nasdaq Biotechnology (NASDAQ:IBB) as it retested its 200DMA as resistance. I like holding this short for a while as a small hedge on my bullish positioning. I am eyeing Caterpillar (NYSE:CAT) for a retest of 50DMA resistance around $155 or $156 before reinitiating puts as another partial hedge. I made a huge flyer on a Tesla (NASDAQ:TSLA) out of the money put. I call this “collapse insurance.” The stock suddenly looks very bearish post-earnings as buyers have failed to do their typical step into the breach upon the first signs of selling. On Thursday, I watched in surprise as a call option I bought around TSLA’s 50DMA melted away.
The chart reviews below cover some of the above-mentioned stocks and more.
CHART REVIEWS
Open Text Corporation (OTEX)
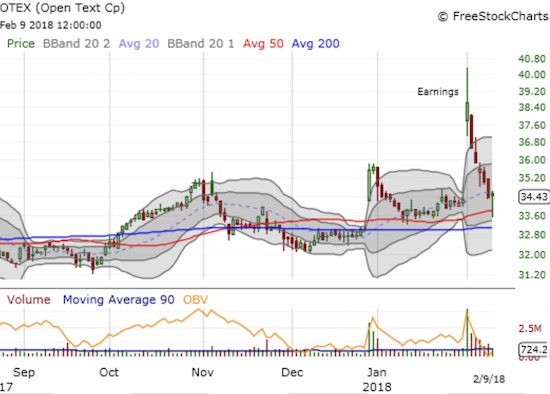
Open Text (OTEX) soared as much as 17.7% after reporting earnings. But those were the end of the good ol’ days. Sellers forced a complete reversal until support finally stood around the 50DMA.
Tesla (NASDAQ:TSLA)
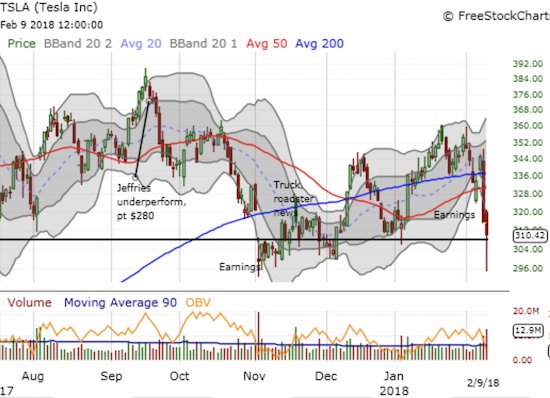
Tesla (TSLA) very briefly held 50 and 200DMA supports after earnings. Sellers have been relentless ever since. The stock traded as low as $294.76 in a retest of the post-earnings low from November.
iShares Nasdaq Biotechnology ETF (IBB)
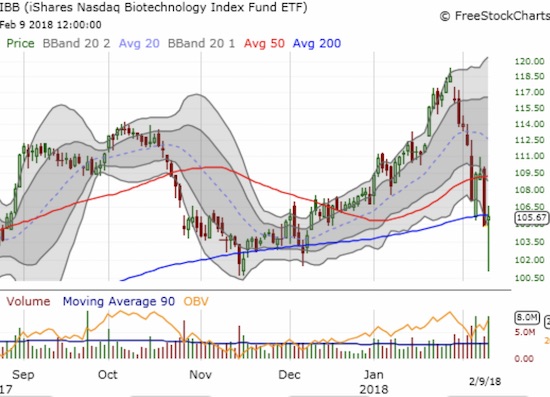
The iShares Nasdaq Biotechnology ETF (IBB) broke down to a test of the lows from November before bouncing back to its 200DMA.
U.S. Concrete, Inc. (NASDAQ:USCR)
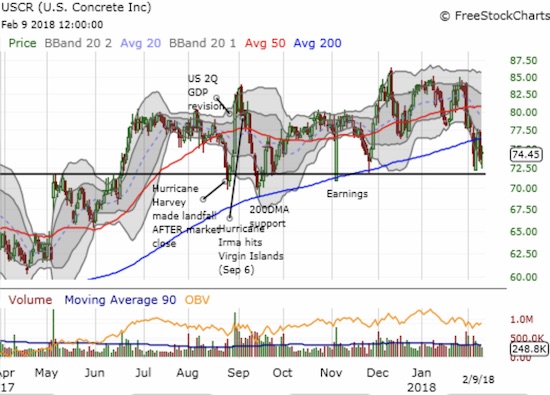
U.S. Concrete (USCR) broke down below its 200DMA again, but at least the post-earnings low held. I am looking for USCR to hold its 7+ trading range.
United Parcel Service, Inc. (NYSE:UPS)
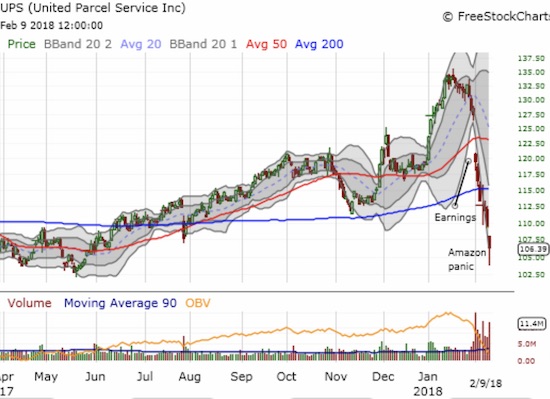
United Parcel Service (UPS) (and FedEx (NYSE:FDX)) are the latest victims of an Amazon.com (NASDAQ:AMZN) panic as the company is supposedly pursuing its own delivery service. Normally, I would jump on this trade for at least a bounce back to its 200DMA, but I am extremely wary given the deeply negative response to earnings.
Amazon.com (NASDAQ:AMZN)
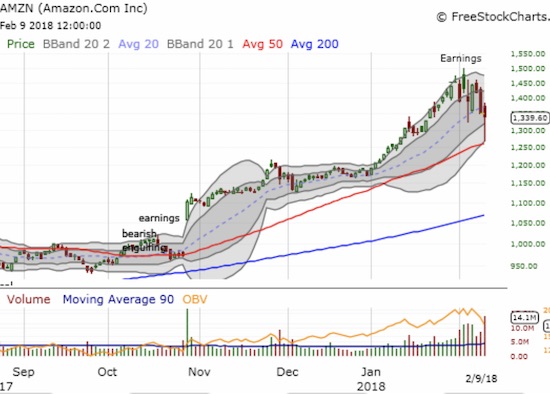
Amazon.com (AMZN) is sitting pretty as one of the strongest stocks during the market sell-off. AMZN survived a test of uptrending 50DMA support. This stock is a top pick given its apparent resilience.
Best Buy (NYSE:BBY)
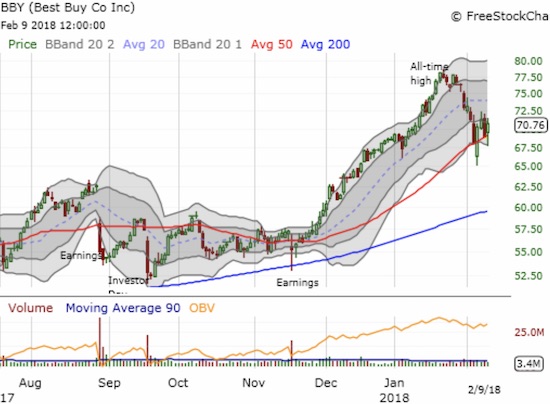
I love the way Best Buy (BBY) has held firm at 50DMA support. I am targeting it for an aggressive buy after closing above last week’s churn.
“Above the 40” uses the percentage of stocks trading above their respective 40-day moving averages (DMAs) to assess the technical health of the stock market and to identify extremes in market sentiment that are likely to reverse. Abbreviated as AT40, Above the 40 is an alternative label for “T2108” which was created by Worden. Learn more about T2108 on my T2108 Resource Page. AT200, or T2107, measures the percentage of stocks trading above their respective 200DMAs.
Active AT40 (T2108) periods: Day #2 under 20% (oversold), Day #5 under 30%, Day #6 under 40%, Day #6 under 50%, Day #7 under 60%, Day #13 under 70%
Daily AT40 (T2108)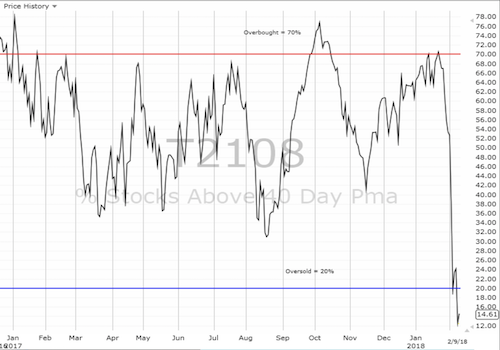
Black line: AT40 (T2108) (% measured on the right)
Red line: Overbought threshold (70%); Blue line: Oversold threshold (20%)
Weekly AT40 (T2108)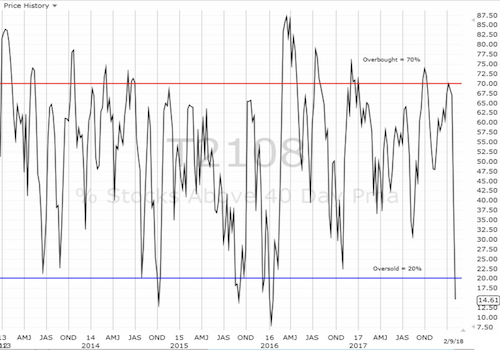
Be careful out there!
Full disclosure: long CAT calls, long TSLA call and put, long OTEX shares, long SPY calendar call spread and calls, short IBB shares, long INTC calls, long AAPL calls, long UVXY puts, long SVXY calls

